Australian Sea Freight 2012-13
This is the latest in a series of BITRE reports that presents statistics on maritime freight in Australia and shows the trend of Australian sea freight over the most recent ten years. The information presented comprises international and coastal freight statistics, the use of coastal voyage permits, vessel activity at Australian ports, and the size and composition of the Australian trading fleet from 2003-04 to 2012-13.
Waterline 54—August 2014
Waterline reports on trends in (a) throughput, (b) container handling productivity on the waterfront and the land side of ports in Australia, and (c) the cost of importing and exporting containers. It covers both the unloading of container ships and the transport of containers from container terminals. In Waterline 54, rail throughput data provided by port authorities is incorporated in calculating the throughput and productivity indicators. This issue covers port terminal activity up to the December quarter 2013.
- Waterline No 54
Infrastructure, transport and productivity
This information sheet reviews trends in Australian productivity with a focus on the transport sector.
Well targeted investments in transport infrastructure result in productivity increases that benefit many other industries. The paper provides for specific examples that cover trucks, freight, waterfront and rail productivity enhancements.
- Infrastructure, transport and productivity
Freightline 1—Australia freight transport overview
The Freightline series is intended to provide information on interregional freight movements across Australia, filling a major gap in Australian transport-related data and information, to help better inform and support policy development and infrastructure planning. The Freightline series begins with a broad overview of the freight task, followed by separate commodity-specific issues that provide more detailed information about the size and location of major freight movements, supply chain composition and key infrastructure components. Freightline 1 (this issue) provides a broad overview of freight movements in Australia, highlighting some of the major commodity flows.
- Freightline 1–Australia freight transport overview
Freightline 2—Australia iron ore freight transport
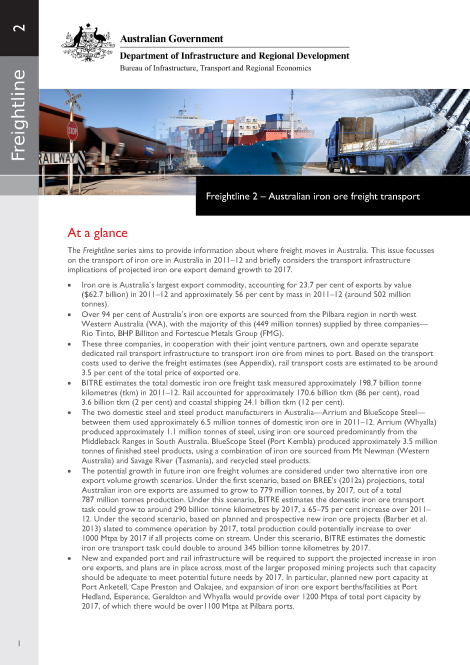
The Freightline series is intended to provide information on interregional freight movements across Australia, filling a major gap in Australian transport-related data and information, to help better inform and support policy development and infrastructure planning. The Freightline series begins with a broad overview of the freight task, followed by separate commodity-specific issues that provide more detailed information about the size and location of major freight movements, supply chain composition and key infrastructure components. Freightline 2 (this issue) focusses on Australian iron ore transport supply chains and freight movements in 2011–12.
- Freightline 2–Australia iron ore freight transport
Waterline 53—January 2014
Waterline reports on trends in (a) throughput, (b) container handling productivity on the waterfront and the land side of ports in Australia, and (c) the cost of importing and exporting containers. It covers both the unloading of container ships and the transport of containers from container terminals. In Waterline 53, the format of the report has been revised and several new productivity measures have been introduced following consultation with industry. This issue covers port terminal activity up to the June quarter 2013.
- Waterline No 53
Tasmanian Freight Schemes—Parameter Review 2013
The Tasmanian Freight Equalisation Scheme operates according to Ministerial Directions (2012) using parameters recommended by the TFES Review Authority (1998). The Tasmanian Wheat Freight Scheme operates under separate Ministerial Directions approved on 25 January 2006.
Infrastructure Investment Macromonitor
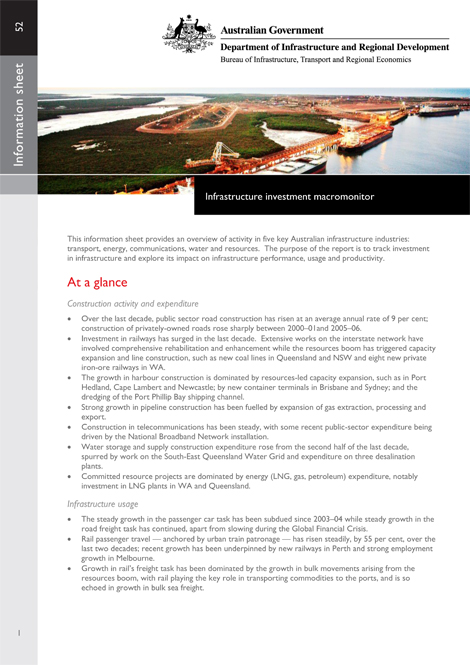
This information sheet provides an overview of activity in five key Australian infrastructure industries: transport, energy, communications, water and resources.
The purpose of the report is to track investment in infrastructure and explore its impact on infrastructure performance, usage and productivity.
- Infrastructure Investment Macromonitor
Tasmanian Passenger and Freight movements
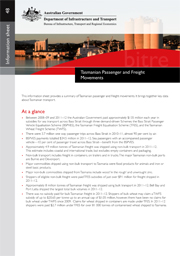
This information sheet provides a summary of Tasmanian passenger and freight movements in 2011–12. It brings together key data about Tasmanian transport from other Bureau publications and unpublished data sources.
- Tasmanian Passenger and Freight movements
Waterline 52—April 2013
This Waterline provides the latest data available on stevedoring productivity and landside performance at Australia's major container ports.
- Waterline No 52
- Landside Performance Indicators

- Stevedoring Productivity
- Port Interface Cost Index
- Ship Visits
- Port Performance–non-financials
- Stevedoring Ship Arrival Reliability