
A dozen facts about transport in Australia
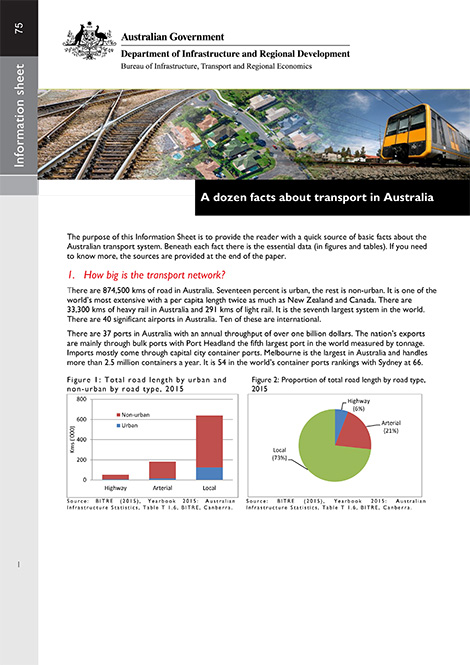
This information sheet covers a wide range of subjects, including commuting, freight, rail, energy and safety. The following 12 facts are included:
- How big is the transport network?
- How far do we travel?
- Is this increasing?
- How do we travel?
- Are we changing how we travel?
- Why do we travel like this?
- What about freight?
- Is freight transport increasing?
- Are we commuting longer?
- How do we pay for transport?
- Is transport becoming more energy efficient and causing less emissions? and
- Is transport safety improving?
- A dozen facts about transport in Australia
Why short-haul intermodal rail services succeed
The shipping container has revolutionised freight transport over the last half-century but its success is bringing challenges, not least in landside container movements. Port-induced road traffic congestion impacts on port arteries and communities and undermines port efficiency. Policymakers and planners seek to shift activities from roads to rail. This is a challenge, however, because most of the containers move over short distances, where trains are relatively uncompetitive. Despite that, there are instances where port–hinterland rail services exist. This report analyses the underlying necessary conditions that need to prevail for those rail services to be sustainable.
- Why short-haul intermodal rail services succeed
Freightline 3—Australia sugar freight transport
The Freightline series is intended to provide information on interregional freight movements across Australia, filling a major gap in Australian transport-related data and information, to help better inform and support policy development and infrastructure planning. The Freightline series begins with a broad overview of the freight task, followed by separate commodity-specific issues that provide more detailed information about the size and location of major freight movements, supply chain composition and key infrastructure components. Freightline 3 (this issue) focusses on Australian sugar-related transport supply chains and freight movements in 2011–12.
- Freightline 3–Australia sugar freight transport
Waterline 57—December 2015
Waterline reports on trends in throughput, container handling productivity and the cost of importing and exporting containers through Australia's 5 major container ports. It covers container exchange with specialised container ships and transport of containers on the landside of the ports.
This issue covers port terminal activity up to the June quarter 2015. It introduces 3 new indicators–2 examine truck movements outside formal booking systems for containers and TEUs; the third quantifies backloaded operations, whereby trucks carry containers on both inbound and outbound legs of their trip.
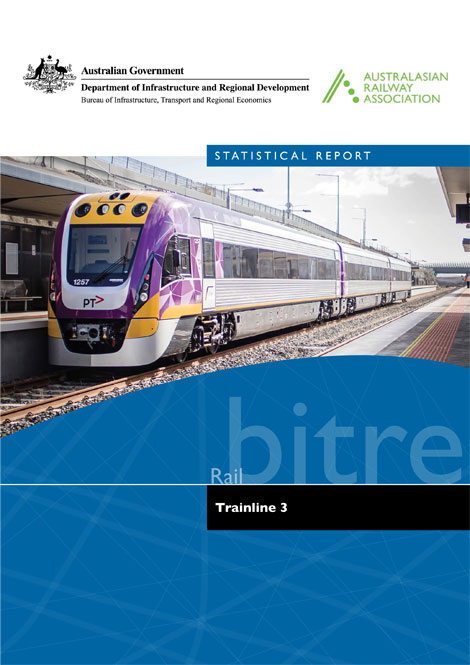
Trainline 3 is a collaborative compendium between the Australasian Railway Association (ARA) and BITRE, providing insights, analysis, and an understanding of the Australian freight and passenger railway industry.
Australia's railways are evolving due to factors within and outside the industry, including changes in bulk and non-bulk logistics, commodity flows, technology, urban rail patronage and regional passenger services. The publication presents an overview and data illustrating these changes in terms of rail tasks performed, characteristics of the railway networks, train operators' rolling stock and aspects of railway performance including safety, environment and reliability.
Australian sea freight 2013–14
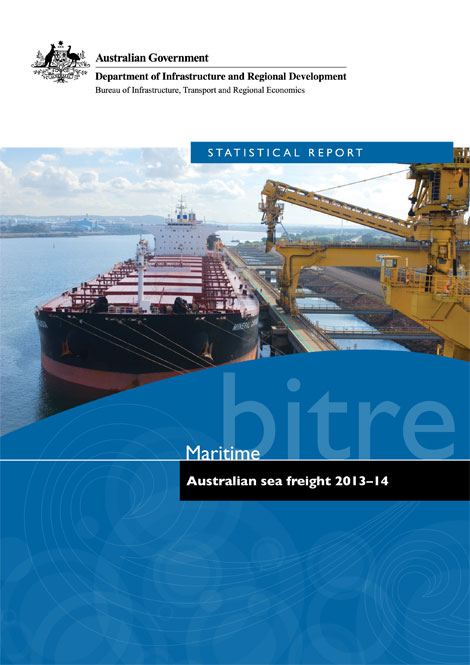
This is the latest in a series of BITRE reports that provide information on Australian sea freight movements, vessel activity, the use of coastal trading licences and the size and composition of the Australian trading fleet. This report contains statistics on maritime freight and shipping activities in Australia from 2004–05 to 2013–14.
Waterline 56—May 2015
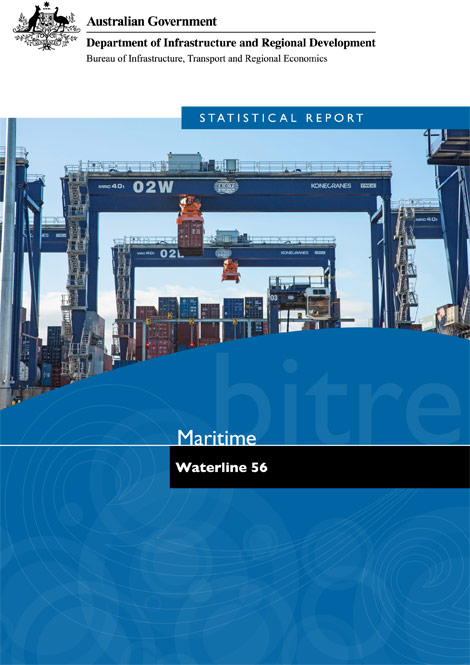
Waterline provides the latest data on throughput, container handling productivity (both wharf-side and landside), and the cost of importing and exporting containers. It covers the unloading of container ships and the transport of containers from terminals. Highlights from this edition include:
- Throughput at Australian ports increased 3% over the period July-December 2014 relative to the previous year, with a total throughput of 3.7 million TEUs. This compares to non-farm GDP growth over the same period of 2.7%: port throughput continues to increase faster than non-farm GDP. Fremantle experienced the strongest increase of 11.3%; the other ports showed more modest growth, except Adelaide, which recorded a 2.6% decline.
- Wharf-side productivity showed a modest improvement in average labour productivity (up 0.9%); however reduced crane rates (down 3.3%) showed lower capital productivity and translated to longer median ship turnaround rates at Brisbane, Sydney and Melbourne. Fremantle exhibited the strongest performance (with elapsed labour rate, crane rate and ship rate improvements of 39.4, 32.8 and 10.9% respectively), with the sharpest declines in Brisbane (elapsed labour rate and ship rate down by 12.3 and 14.5% respectively).
- Land-side efficiency continued its decline in all ports except Adelaide: average truck and container turnaround times increased by 5.7 and 4.7%, respectively.
- The Port Interface Cost Index (PICI) increased by $10-$14/TEU over the reporting period, with the larger increases for smaller vessel sizes. Port Interface Cost for medium- and large-size vessels is now approaching parity. While historically, port handling costs have been declining as the general price level across the economy (the GDP deflator) has been increasing, this trend has reversed since 2010, and port interface costs are now rising.
Changes in Australia's industry structure: cities and regions, 2006–2011
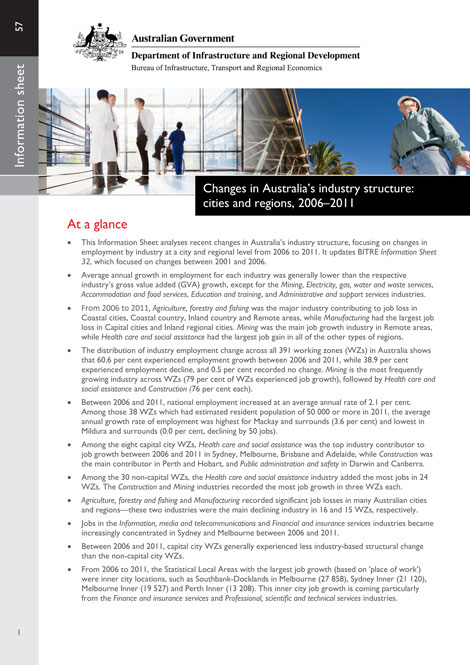
This Information Sheet identifies recent trends (2006 to 2011) in employment by various industries for regional areas, capital cities and non-capital cities. It updates BITRE's previous Information Sheet 32, which focused on employment changes between 2001 and 2006. The information presented in this publication will assist regional communities (including local government and RDAs) to understand how their regions are changing, and help regions map out where their opportunities and challenges might lie.
- Changes in Australia's industry structure: cities and regions, 2006–2011
Waterline 55—January 2015
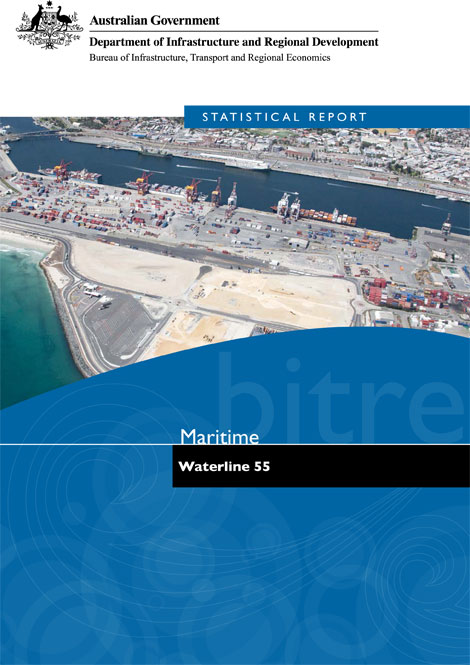
Waterline reports on trends in throughput, container handling productivity on the waterfront and landside of ports in Australia, and the cost of importing and exporting containers via 5 container ports. It covers the loading and unloading of container ships and the transport of containers from container terminals. In Waterline 55, rail throughput data provided by port authorities is incorporated in calculating the throughput and productivity indicators. This issue covers port terminal activity up to the June quarter 2014.
Containerised and non-containerised trade through Australian ports to 2032–33
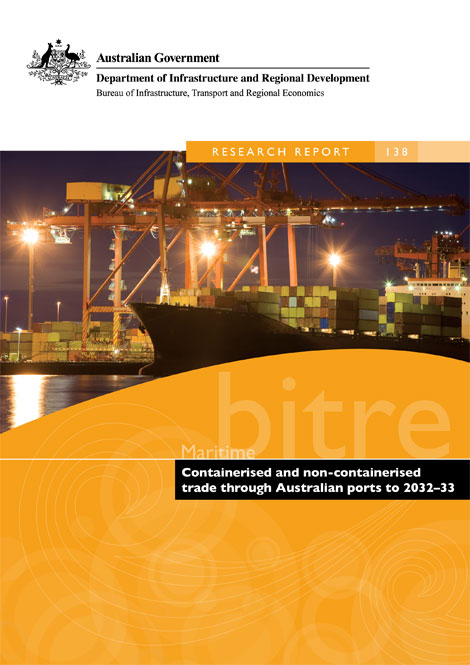
This report presents 20-year forecasts of exports and imports of containerised and non-containerised freight and sea passenger movements through Australia's 5 largest capital city ports and, in aggregation, all other ports. The forecasts, which update those previously published by BITRE in 2002, 2006 and 2010, are driven by population, real income, exchange rates, import prices and export prices. The most recent economic outlook and population growth forecasts for Australia and its major trading partners have been used to derive the forecasts. The forecasts imply that Australia's sea trade will double over the next 20 years, largely due to the continuing positive economic outlook for Australia and its major trading partners. The long-term outlook for the cruise shipping industry is also positive, largely due to the projected economic growth in source countries of cruise passengers, particularly the USA.