
Waterline No 40—May 2006
This issue contains articles on the role of the new Maritime Security Identification Card system and on Australian International Shipping.
Australian Transport Statistics 2006
Australian Transport Statistics provides an easy introduction to a diverse range of transport statistics. Topics include employment, GDP, passenger and freight movements, trade, funding, motor vehicles, fatalities and estimated greenhouse gas emissions attributed to the transport industry. Various international comparisons are included and details provided for the road, rail, marine and aviation sectors. Data are gathered from various sources within the Bureau of Transport and Regional Economics and from external organisations.
Interstate Freight on States Roads
Paper given to the 29th Australasian Transport Research Forum, 27–29 September 2006, Crowne Plaza Surfers Paradise, Gold Coast. Authors: David Gargett, Afzal Hossain and David Cosgrove.
- Interstate Freight on States Roads
Port Level Forecasts of Container and Ship Movements in Australia: 2004–05 to 2024–25
Paper given to the 29th Australian Transport Research Forum conference to be held from 27 to 29 September 2006 in Gold Coast. Authors: Krishna Hamal, Benjamin James, Mark Cregan.
- Port Level Forecasts of Container and Ship Movements in Australia: 2004–05 to 2024–25
Waterline No 41—December 2006
In addition to the usual content on wharfside indicators of productivity, Waterline 41 contains a feature article on a set of new indicators of productivity improvements focusing on the interface between port terminals and the trucks and trains that deliver containers to and pick up containers from the terminals.
Indicators include number of trucks processed, container turnaround time, rail transported containers as percent of containers processed on the landside of terminal, and indicators on the availability and use of vehicle booking system time slots at port terminals.
The article includes preliminary estimates of the indicators. However these estimates are based on incomplete data and some, for example rail mode share, are unreliable. They are published at this stage to indicate the intended scope of the new indicators and for comment before formal reporting of the indicators starts in 2007.
Container and Ship Movements Through Australian Ports 2004–05 to 2024–25

This report presents the national and port level forecasts of container and ship movements through Australian ports over the next twenty years.
- Container and Ship Movements Through Australian Ports 2004–05 to 2024–25
Filling a gap in rail data: an investigation of the Gheringhap Loop train sightings

This paper analyses train sightings data collected at Gheringhap, Victoria, located on the Melbourne to Adelaide main line. These sightings provide an independent source of information on train movements, train lengths, and reliability, and, given knowledge of freight volumes, can be used to estimate average wagon loads. In cases where trains are not scheduled, sightings such as these are presently the only publicly available source of data for freight volumes on specific routes.
Following the growth in private train operations since the mid-1990s and the privatisation of National Rail in 2002, rail freight activity data became increasingly scarce. The lack of data can be a challenge for the BTRE in providing the government with timely and accurate information about trends in Australian freight transport. The rail industry has recognised this deficiency: the Australasian Railway Association and its members are working with the BTRE to produce the first public report on the performance of the Defined Interstate Rail Network and to supply data for AusLink planning.
In the meantime, the BTRE has investigated other potential data sources, including information from railway enthusiasts. This paper presents an analysis of one such source of rail data that is reported online, from video-taped observations made and collated by Graham Elliott at Gheringhap Loop, Victoria, on the mainline between Adelaide and Melbourne. The paper provides a short review of the reliability of the data, makes observations about trends in freight activity from the data set, and draws some conclusions about the value of the data collection method.
- Filling a gap in rail data: an investigation of the Gheringhap Loop train sightings
Australian maritime trade 2000–01 to 2004–05
Australian maritime trade: 2000–01 to 2004–05 extends data available through the BTRE's Australian Sea Freight publications by including information on markets, shipping lanes, key trade routes, traded commodities and passenger services associated with Australia's maritime trade.
- Australian maritime trade 2000–01 to 2004–05
Australian sea freight 2004–05
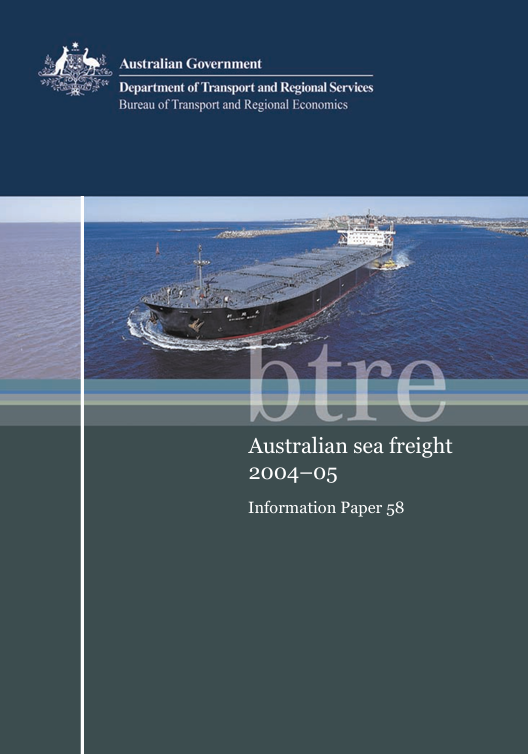
Statistics on the movement of Australian freight by sea, information on port activity, fleet structure and use of coastal permits. This edition focuses on sea freight activity around Australia during 2004–05.
Waterline No 42—July 2007
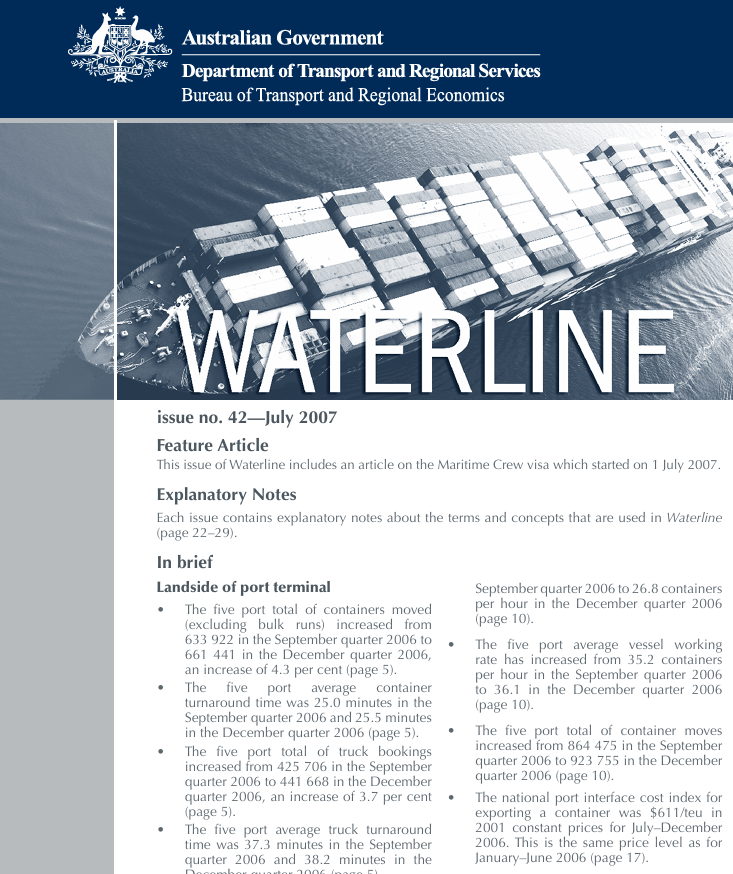
This edition of Waterline includes an article on the Maritime Crew visa which started on 1 July 2007. Waterline 42 incorporates a new section dealing with landside performance indicators, which include containers per truck, average container turnaround time and truck turnaround time. It also includes landside of container terminal task indicators such as total containers by road, TEUs by road and total trucks processed. Some charts also show total containers by rail. The new section commences with the September and December quarters 2006.