
Waterline No 42—July 2007
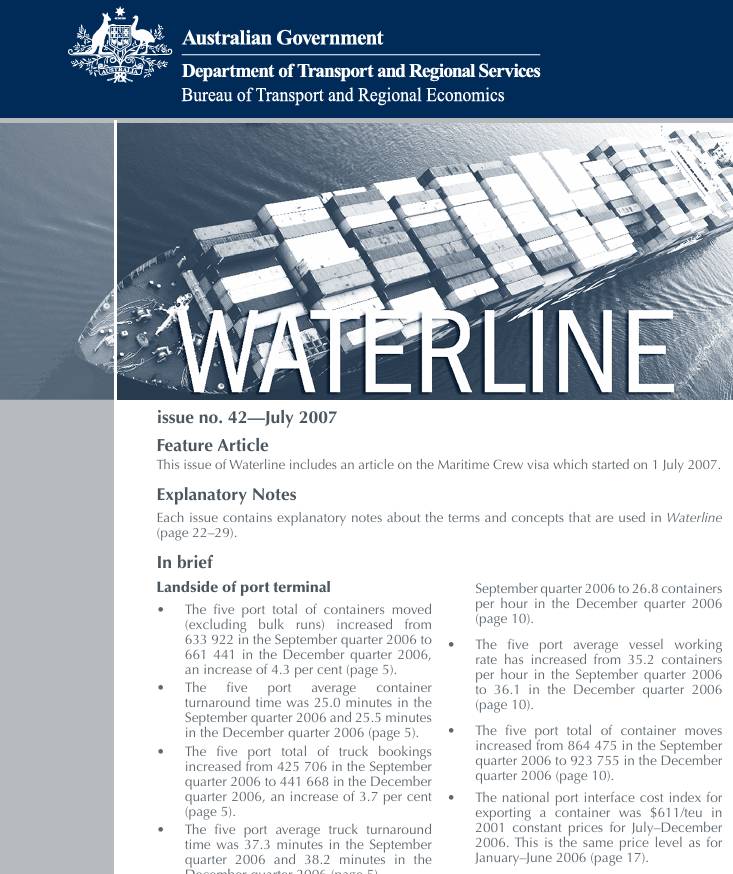
This edition of Waterline includes an article on the Maritime Crew visa which started on 1 July 2007. Waterline 42 incorporates a new section dealing with landside performance indicators, which include containers per truck, average container turnaround time and truck turnaround time. It also includes landside of container terminal task indicators such as total containers by road, TEUs by road and total trucks processed. Some charts also show total containers by rail. The new section commences with the September and December quarters 2006.
International Freight to/from Australia
The Excel file below contains tables showing the value and weight of Australian international imports and exports each quarter, by sea freight (liner and non-liner) and by air. The time series covers the period from 3rd quarter 1984 to the 1st quarter 2007.
The Bureau of Transport and Regional Economics has taken due care in preparing the analyses contained in these tables. However, noting that data used for the analyses have been provided by third parties, the Commonwealth gives no warranty to the accuracy, reliability, fitness for purpose, or otherwise of the information.
- International Freight to/from Australia

Australian sea freight 2005–06
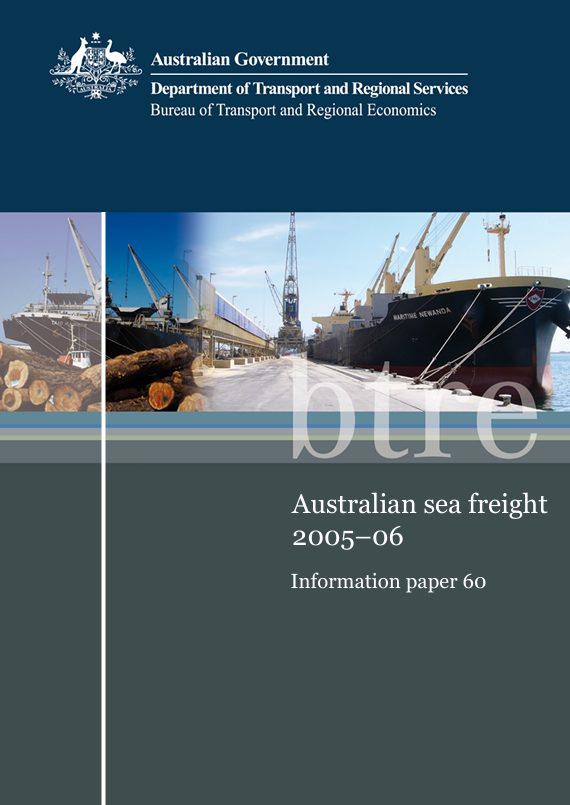
Statistics on the movement of Australian freight by sea, information on port activity, fleet structure and use of coastal permits. This edition focuses on sea freight activity around Australia during 2005–06.
Waterline 43—January 2008
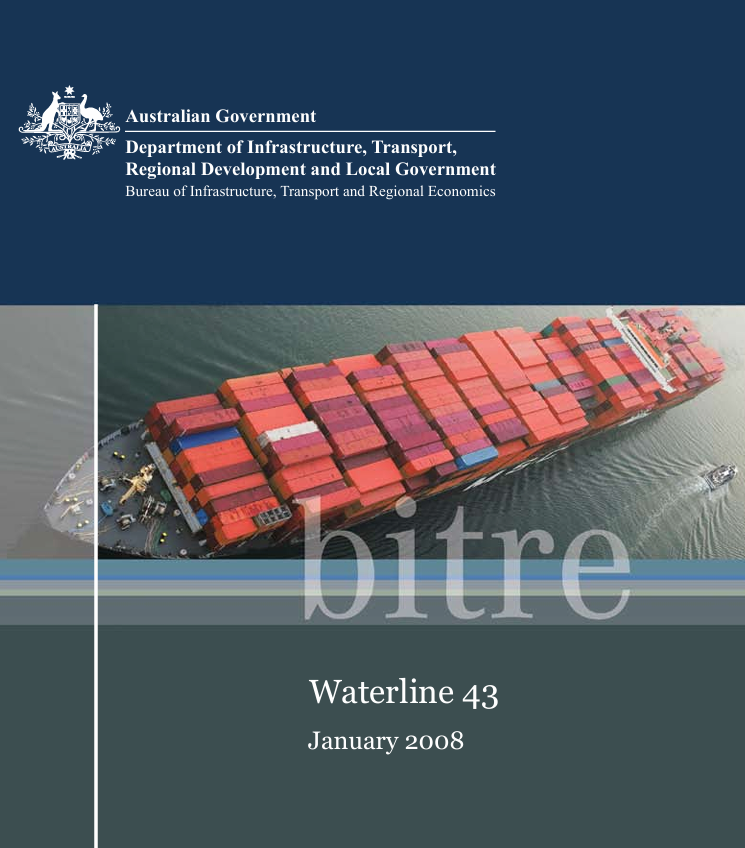
Waterline reports on trends in container handling productivity on the waterfront in Australia and the cost of importing and exporting containers. It covers the unloading of container ships and the transport of containers from container terminals.
Australian Transport Statistics Yearbook 2007
Australian Transport Statistics provides a short summary of a diverse range of transport statistics. Topics include employment, GDP, passenger and freight movements, trade, funding, motor vehicles, fatalities and estimated greenhouse gas emissions attributed to the transport industry. Information is provided for the road, rail, maritime and aviation sectors. Data are gathered from various sources both within BTRE and external organisations.
- Australian Transport Statistics Yearbook 2007
- Australian Transport Statistics Yearbook 2007–Spreadsheets

Australian sea freight, 2006–07
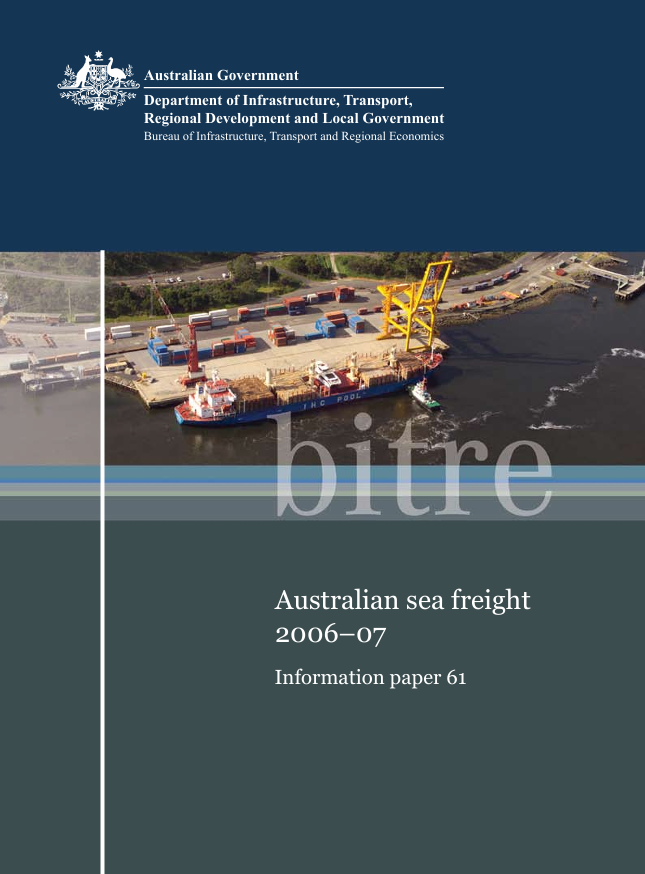
Statistics on the movement of Australian freight by sea, information on port activity, fleet structure and use of coastal permits. This edition focuses on sea freight activity around Australia during 2006–07.
Australian Transport Statistics 2008—pocket booklet
Australian Transport Statistics provides a short summary of a diverse range of transport statistics. Topics include employment, GDP, passenger and freight movements, trade, funding, motor vehicles, fatalities and estimated greenhouse gas emissions attributed to the transport industry.
Waterline 44—August 2008
Waterline reports on trends in container handling productivity on the waterfront in Australia and the cost of importing and exporting containers. It covers the unloading of container ships and the transport of containers from container terminals.
Tasmanian Freight Schemes—Parameter Review 2008
In March 2006 the Productivity Commission was asked to 'report on the merits and weaknesses of the current arrangements for subsidising containerised and bulk shipping between the mainland and Tasmania and provide recommendations on an appropriate future approach and/or arrangements.' This review covered both the Tasmanian Freight Equalisation Scheme and Tasmanian Wheat Freight Scheme.
Freight Rates in Australia 1964–65 to 2007–08

This Information Sheet provides indexed trends in average interstate non-bulk freight rates, from 1964–65 to 2007–08, updating the freight rate indexes previously published in Freight Rates in Australia, Information Sheet 19 (BTRE 2002). The estimates show that, following generally declining real freight rates over the previous two decades, real freight rates for road, rail and long-distance coastal shipping have risen since 2000–01 (Table 1 provides nominal and real indexed freight rate series and Figures 1 to 4 illustrate indexed trends in real freight rates). Recent increases in crude oil prices, and flow through to diesel fuel prices, have been an important contributing factor in recent freight rate increases for road, rail and coastal shipping.
- Freight Rates in Australia 1964–65 to 2007–08