
Australian sea freight, 1999–2000
The Australian Sea Freight series presents statistics on the movement of Australian freight by sea, as well as information on port activity, fleet structure, and use of coastal permits. This edition focuses on sea freight activity around Australia during 1999–2000.
Focus on regions No. 1: Industry Structure

Australia, like many other developed countries, has experienced a decline in the importance of the manufacturing and agriculture sectors over recent decades, and strong growth in the services sector. In particular, Business services accounts for a large and growing share of national value added and employment. Between 1991 and 2001, the Business services industry was the single largest source of employment growth in all States and Territories.
- Focus on regions No. 1: Industry Structure
- Industry Structure Database 2003

Australian sea freight, 2000–01
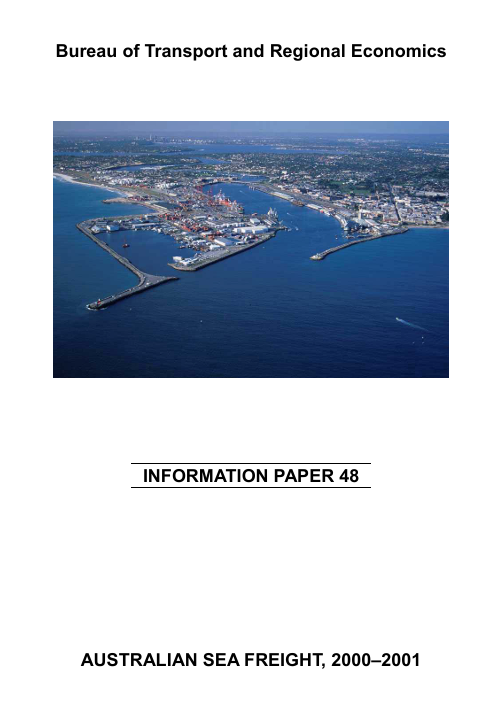
The Australian Sea Freight series presents statistics on the movement of Australian freight by sea, as well as information on port activity, fleet structure, and use of coastal permits. This edition focuses on sea freight activity around Australia during 2000–01.
Australian sea freight, 2001–02
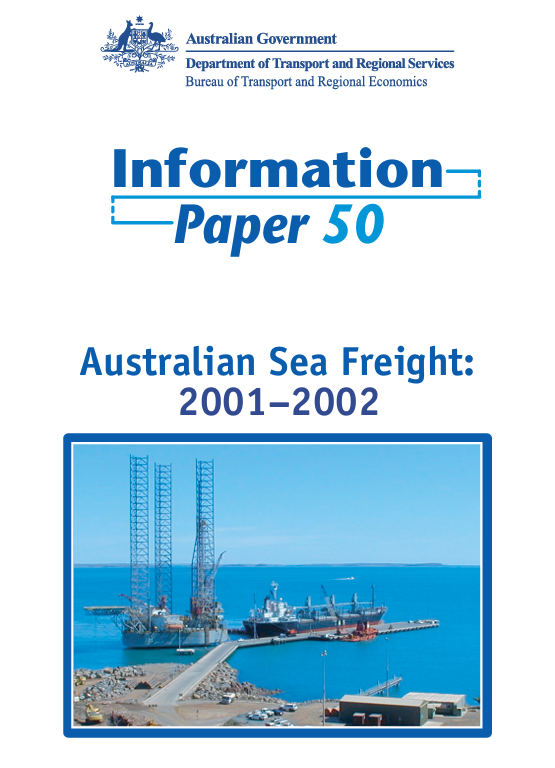
The Australian Sea Freight series presents statistics on the movement of Australian freight by sea, as well as information on port activity, fleet structure, and use of coastal permits. This edition focuses on sea freight activity around Australia during 2001–02.
Focus on Regions No. 2: Education, Skills and Qualifications
This report analyses trends in educational attainment and occupational status in Australia. It investigates the spatial distribution of skills, qualifications, selected professionals and skilled tradespeople across Australia's regions in the period 1991 to 2001.
- Focus on Regions No. 2: Education, Skills and Qualifications
- Human capital education database
- Human capital occupation database
Australian sea freight, 2002–03
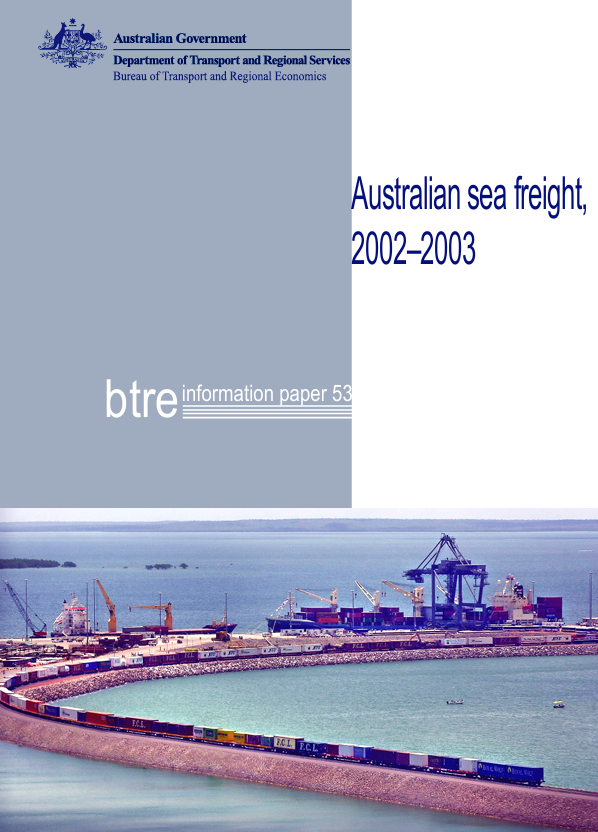
The Australian Sea Freight series presents statistics on the movement of Australian freight by sea and information on port activity, fleet structure, and use of coastal permits. This edition focuses on sea freight activity around Australia during 2002–03.
Focus on Regions No 3: Taxable Income

The paper and associated database directly tackle the issue of quantifying economic growth in regions. BTRE derived regional economic activity indices for every Local Government Area in Australia from 1980–81 to 2004–05. The figures are based on Australian Taxation Office individual income data which have been reworked to allow easy comparisons between standard regions and over time.
- Focus on Regions No 3: Taxable Income
- Taxable Income Database [updated 23 Jan 2008]
Focus on Regions No 4: Social Capital
Social capital theory proposes that social networks and norms have a role to play in influencing a community's development. This paper presents and analyses statistical information relating to social capital in Australia and its regions, using a set of 33 social capital indicators for 2001–02. It also explores the relationship between social capital and the economic and social wellbeing of Australia's regions. The paper is accompanied by the BTRE's Social Capital Indicators Database.
- Focus on Regions No 4: Social Capital
- Social capital indicators
Australian sea freight 2003–04
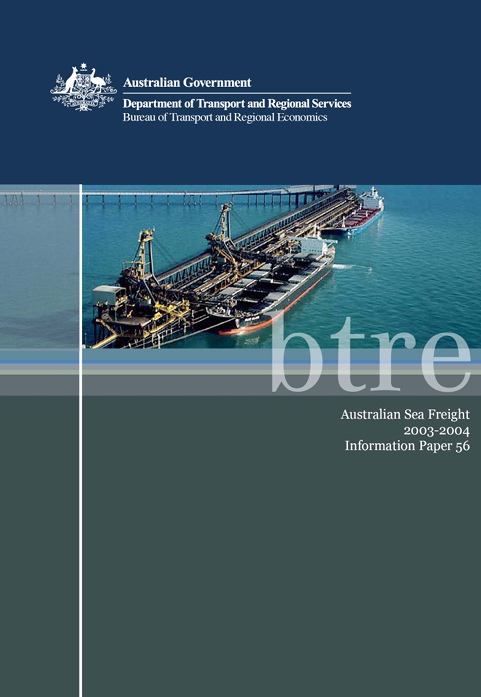
Statistics on the movement of Australian freight by sea, information on port activity, fleet structure and use of coastal permits. This edition focuses on sea freight activity around Australia during 2003–04.
Filling a gap in rail data: an investigation of the Gheringhap Loop train sightings
This paper analyses train sightings data collected at Gheringhap, Victoria, located on the Melbourne to Adelaide main line. These sightings provide an independent source of information on train movements, train lengths, and reliability, and, given knowledge of freight volumes, can be used to estimate average wagon loads. In cases where trains are not scheduled, sightings such as these are presently the only publicly available source of data for freight volumes on specific routes.
Following the growth in private train operations since the mid-1990s and the privatisation of National Rail in 2002, rail freight activity data became increasingly scarce. The lack of data can be a challenge for the BTRE in providing the government with timely and accurate information about trends in Australian freight transport. The rail industry has recognised this deficiency: the Australasian Railway Association and its members are working with the BTRE to produce the first public report on the performance of the Defined Interstate Rail Network and to supply data for AusLink planning.
In the meantime, the BTRE has investigated other potential data sources, including information from railway enthusiasts. This paper presents an analysis of one such source of rail data that is reported online, from video-taped observations made and collated by Graham Elliott at Gheringhap Loop, Victoria, on the mainline between Adelaide and Melbourne. The paper provides a short review of the reliability of the data, makes observations about trends in freight activity from the data set, and draws some conclusions about the value of the data collection method.
- Filling a gap in rail data: an investigation of the Gheringhap Loop train sightings