Location and other risk factors in crashes
This information sheet reports results of a study into the risk factors of vehicle crashes given a crash has occurred in terms of whether it results in the death of a person involved. Factors include vehicle type and age, whether a restraint or helmet was worn, nature of crash, time of day and location-specific factors such as the built-up or rural character of an area, the distance to high-care emergency medical facility and environmental conditions i.e. sunrise, sunset or night-time.
- Location and other risk factors in crashes
Modelling Road Safety in Australian States and Territories
This Information Sheet describes modelling of road fatality rates for the eight Australian States and Territories, and fatality and injury rates for Australia as a whole. The models are constructed 1) to allow an understanding of the past forces underlying the fatality rates in each jurisdiction covered, and 2) to allow forecasts of future trends in road safety–or rather its obverse, death and injury.
- Modelling Road Safety in Australian States and Territories
- Modelling Road Safety in Australian States and Territories
Spending by Australian households on owning and operating vehicles in 2015–16
This Information Sheet presents data on Australian households' expenditure patterns, based on the ABS Household Expenditure Survey (HES) for 2015–16. It updates BITRE Information Sheet 86 Spending by Australian households on owning and operating vehicles (BITRE 2017a), which relied on 2009–10 HES data. It details the composition of household expenditure on owning and operating vehicles and explores variation in the incidence of these costs across different types of households, such as capital city and regional households, and high income and low income households. This updated analysis also investigates changes in vehicle-related spending since 2009–10, with the aim of identifying any significant changes that have occurred for particular types of regions or particular demographic groups.
- Spending by Australian households on owning and operating vehicles in 2015–16
Fuel economy of Australian passenger vehicles—a regional perspective
This information sheet presents Australian data on how realised rates of fuel consumption vary over time, and how the rates depend on key vehicle characteristics such as number of cylinders, fuel type and vehicle age. It also investigates state/territory differences in fuel economy and presents new small area estimates of the average rate of fuel consumption for Australia's regions.
These small area estimates are based on the composition of the passenger vehicle and motorcycle fleet in the region, and are derived at both the Statistical Area Level 3 (SA3) and Statistical Area Level 4 (SA4) scale. The key data sources are the Australian Bureau of Statistics (ABS) Survey of Motor Vehicle Use (SMVU) 2016 and the ABS Census of Motor Vehicles 2016.
- Fuel economy of Australian passenger vehicles–a regional perspective
Growth in the Australian Road System
This information sheet presents estimates of Kilometres and lane-kilometres of road length for Australian States and Territories back to 1910. It provides the same data for Metropolitan Australia back to 1910, and for individual cities back to 1970.
It also introduces the concept of value equivalent lane-kilometres, where lane-kilometres for different road types are weighted by current value estimates.
The latter concept allows a clearer picture of the growth in the value of Australian road infrastructure over time–which is substantial.
- Growth in the Australian Road System
Infrastructure and Transport PPPs and Privatisation in Australia
This information sheet provides a list of infrastructure and transport-related Public Private Partnerships and privatisations in Australia since 1980. To the Bureau of Infrastructure Transport and Regional Economics' (BITRE) knowledge, this is the most comprehensive list on the subject to date.
One hundred and ninety seven economic infrastructure assets have been privatised or procured through PPPs since 1980. Several privatisations were undertaken in multiple stages, including, for example, the privatisations of Telstra and Qantas. Including all these stages takes the total list to 207 entries. The list excludes assets sold solely to state-owned enterprises, and non-sewage waste management services.
- Infrastructure and Transport PPPs and Privatisation in Australia
Freight Rates in Australia
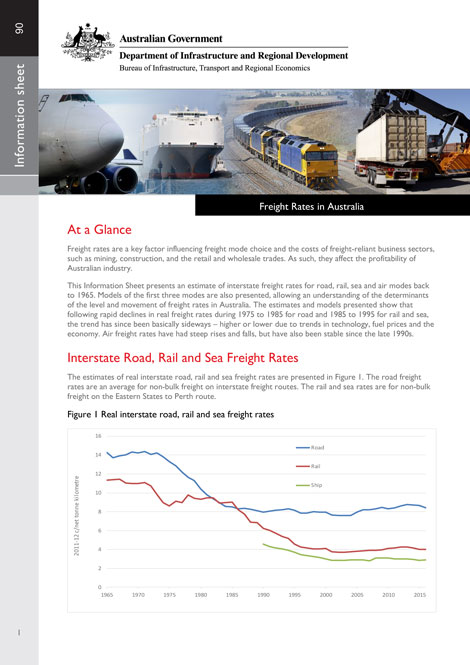
This Information Sheet presents an estimate of interstate freight rates for road, rail, sea and air modes back to 1965. Models of the first three modes are also presented, allowing an understanding of the determinants of the level and movement of freight rates in Australia.
The estimates and models presented show that following rapid declines in real freight rates during 1975 to 1985 for road and 1985 to 1995 for rail and sea, the trend has since been basically sideways–higher or lower due to trends in technology, fuel prices and the economy.
- Freight Rates in Australia
Spending by Australian households on owning and operating vehicles
In this research, several elements of spending are examined, including the composition of that expenditure, the contribution of taxes and government charges, how the expenditure varies by broad region type and by key demographic characteristics, as well as the characteristics of those households with the greatest expenditure on owning and operating vehicles.
- Spending by Australian households on owning and operating vehicles
This information sheet provides an overview of the current status of motorcycling safety in Australia. In 2016 motorcyclist deaths increased by 22 per cent, to 248 deaths (almost 1 in five road deaths). This represents an increase of 7.4 per cent on the National Road Safety Strategy base years (2008-2010).
While the national trend in motorcyclist fatality rates over the last decade has improved by 40 per cent, increased exposure means that the number of motorcyclist deaths in Australia is now similar to 10 years ago. This underpins the need to identify further areas for improvement and focus efforts on reducing motorcyclist fatalities and hospitalised injuries.
- Motorcycling Safety
Urban Passenger fares
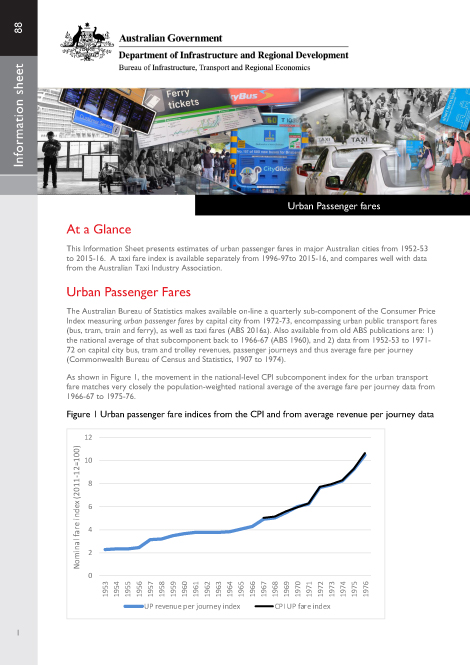
This Information Sheet presents estimates of urban passenger fares in major Australian cities from 1952-53 to 2015-16. A taxi fare index is available separately from 1996-97 to 2015-16. The general trend has been for rising real urban passenger fares, except during the period 1973-74 to 1979-80, when real fares fell as nominal fare levels failed to keep up with higher inflation rates. Rises in both real urban passenger fares and real taxi fares slowed after 2000-01.
- Urban Passenger fares