
Long-term trends in urban public transport
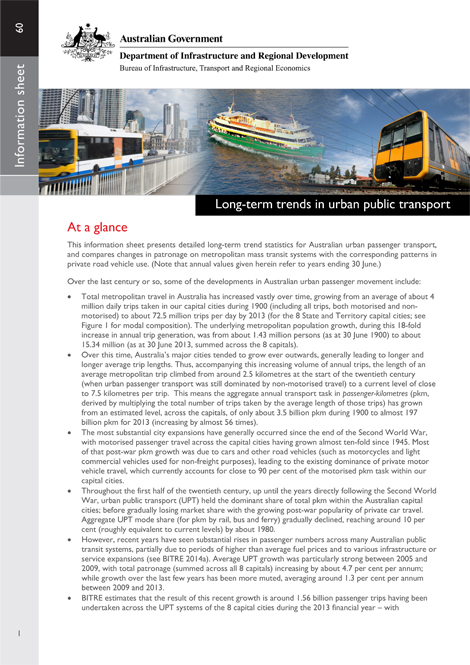
BITRE Information Sheet 60 provides detailed long-term trend statistics for Australian urban passenger transport. Historical time-series on passenger movement within the Australian capital cities, covering more than a century, contrast changes over time in patronage on urban public transport (UPT) systems with the corresponding patterns of private road vehicle use.
- Long-term trends in urban public transport
- Urban Transport Summary for 2013
- Latest urban transport statistics
Urban public transport: updated trends
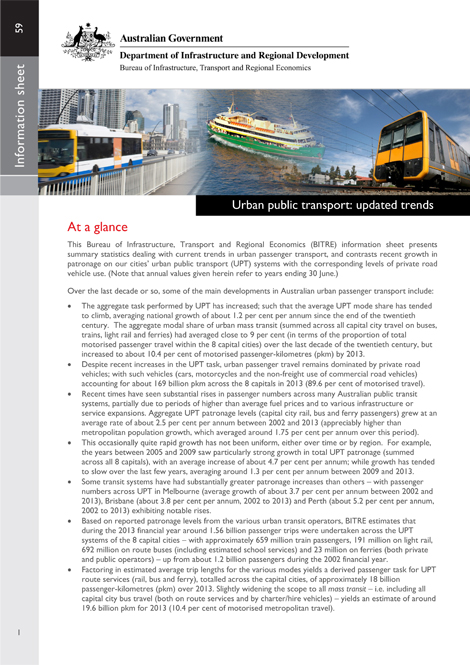
BITRE Information Sheet 59 summarises recent trends in Australian urban passenger transport–contrasting strong growth in urban public transport (UPT) over the last decade (with 2013 task levels almost 30 per cent higher than 2004) with that of private road vehicle use (with car travel in 2013 only about 3 per cent higher than 2004). Details or trend statistics are provided, across the State and Territory capital cities, for modal composition, travel growth rates, UPT cost recovery and transit service levels.
- Urban public transport: updated trends
- Urban Transport Summary for 2013
- Latest urban transport statistics
Saturating daily travel
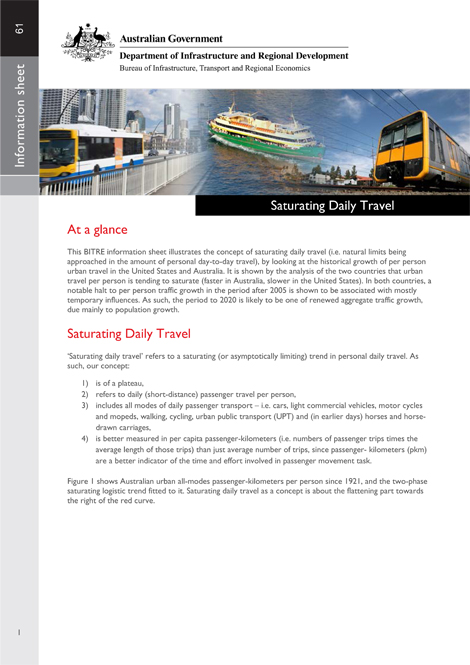
The Information Sheet models and forecasts urban passenger travel in Australian and American cities from 1921 to present. Passenger travel per person is saturating and so future growth in total urban travel will be closely linked to population growth.
- Saturating daily travel
Infrastructure, transport and productivity
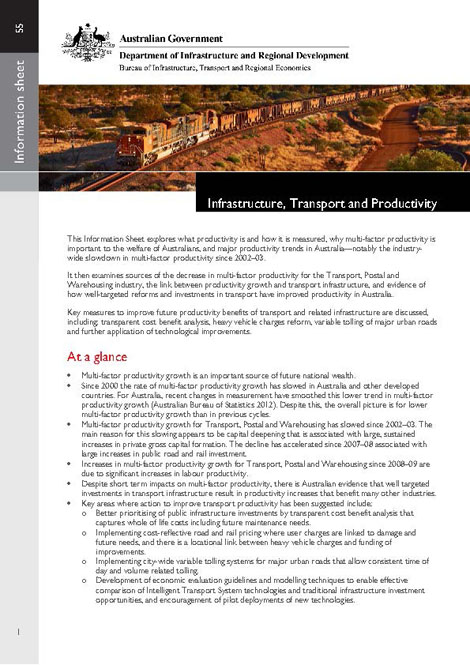
This information sheet reviews trends in Australian productivity with a focus on the transport sector.
Well targeted investments in transport infrastructure result in productivity increases that benefit many other industries. The paper provides for specific examples that cover trucks, freight, waterfront and rail productivity enhancements.
- Infrastructure, transport and productivity
Who's using the roads: variations in usage by drivers
This information sheet presents estimates of the variation in use of roads by drivers.
It finds that road use is highly unequally distributed among motorists, with most vehicles driven relatively low distances while a few drive long distances. The uneven distribution is particularly pronounced for motorcycles and 'other' trucks.
- Who's using the roads: variations in usage by drivers