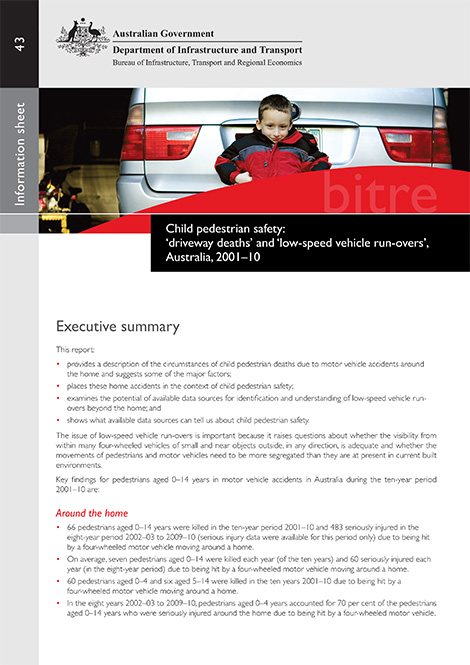
Child pedestrian safety: ‘driveway deaths’ and ‘low-speed vehicle run-overs’, Australia, 2001–10
Freight vehicle congestion in Australian capital cities – 2023
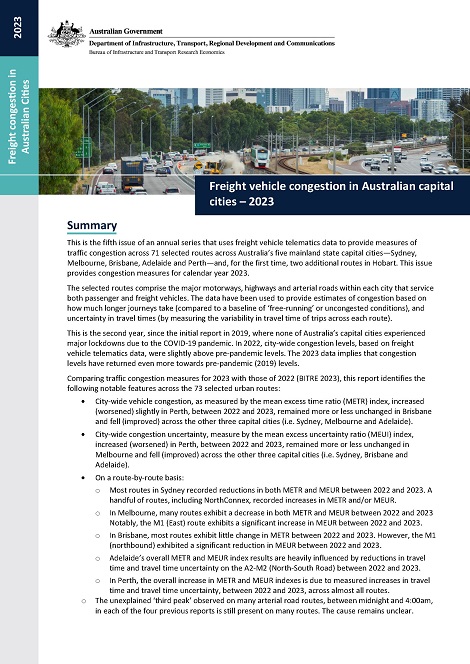
This publication is the fifth in an annual series that uses vehicle telematics data to provide measures of traffic congestion for freight vehicles on selected routes across Australia’s five mainland state capital cities – Sydney, Melbourne, Brisbane, Adelaide and Perth – and, for the first time, two additional routes in Hobart. The selected routes comprise the major motorways, highways and arterial roads within each city that service both passenger and freight vehicles. This release includes congestion measures for 73 separate routes. The estimates presented in this report cover calendar year 2023.
This is the second year, since the initial report in 2019, where none of Australia’s capital cities experienced major lockdowns as part of the COVID-19 pandemic, and city-wide congestion levels have more or less returned to pre-pandemic levels. City-wide freight vehicle congestion, as measured by the mean excess travel time index, increased (worsened) slightly in Perth, remained more or less unchanged in Brisbane, and declined (improved) in the Sydney, Melbourne and Adelaide between 2022 and 2023. Copies of the summary measure data displayed in the report are also available here.
Freight vehicle congestion in Australia's five major cities – 2022
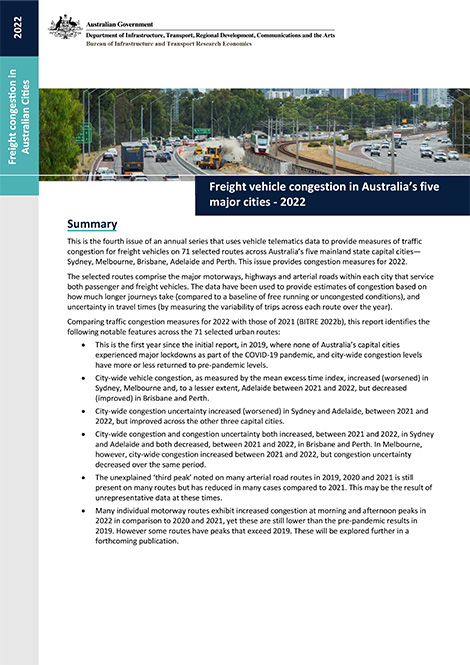
This publication is the fourth in an annual series that uses vehicle telematics data to provide measures of traffic congestion for freight vehicles for selected routes across Australia’s five mainland state capital cities—Sydney, Melbourne, Brisbane, Adelaide and Perth. The selected routes comprise the major motorways, highways and arterial roads within each city that service both passenger and freight vehicles. This release includes measures for 71 routes. The estimates presented in this report cover calendar year 2022, and include comparisons with 2021 traffic congestion levels.
This is the first year since the initial report, in 2019, where none of Australia’s capital cities experienced major lockdowns as part of the COVID-19 pandemic, and city-wide congestion levels have more or less returned to pre-pandemic levels. In particular, city-wide vehicle congestion, as measured by the mean excess time index, increased (worsened) in Sydney, Melbourne and, to a lesser extent, Adelaide between 2021 and 2022, but decreased (improved) in Brisbane and Perth. Many individual motorway routes exhibit increased congestion at morning and afternoon peaks in 2022, compared to 2020 and 2021. On some routes measured congestion is still lower than the pre-pandemic results in 2019. On other routes, congestion peaks exceed 2019 levels. Copies of the data displayed in the report are available here and on data.gov.au.
This is not the latest release. View the latest Working zones update
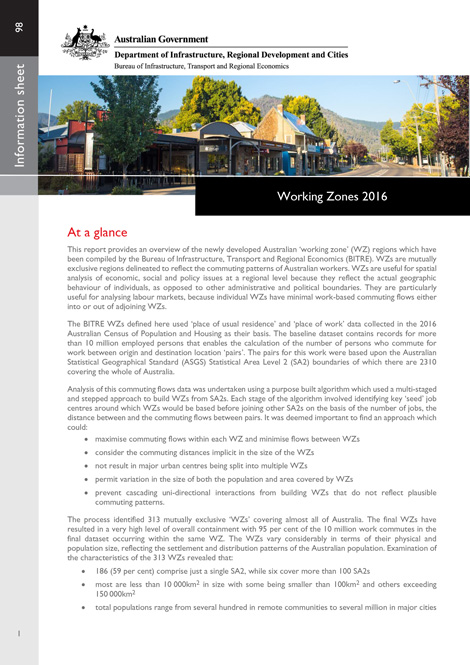
This report provides an overview of the newly developed Australian 'working zone' (WZ) regions which have been compiled by the Bureau of Infrastructure, Transport and Regional Economics (BITRE). WZs are mutually exclusive regions delineated to reflect the commuting patterns of Australian workers. WZs are useful for spatial analysis of economic, social and policy issues at a regional level because they reflect the actual geographic behaviour of individuals, as opposed to other administrative and political boundaries. They are particularly useful for analysing labour markets, because individual WZs have minimal work-based commuting flows either into or out of adjoining WZs.
- Working Zones 2016
- Working Zones 2016 Data
- Working Zones 2016 to SA2 Concordance
- Working Zones 2016 Shape File

Run-off road crashes in Australia, 2016-2020
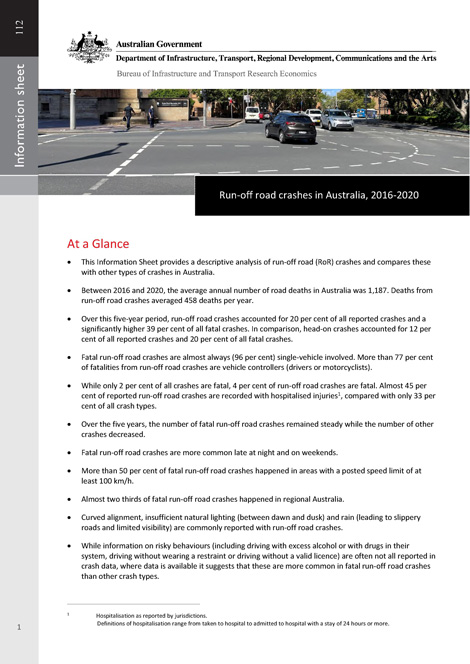
This Information Sheet provides descriptive analysis of run-off road (RoR) crashes and compares these with other types of crashes in Australia. Between 2016 to 2020, the average annual number of road deaths in Australia was 1,187. Deaths from run-off road crashes averaged 458 deaths per year. Run-off road crashes accounted for 20 per cent of all crashes and a significantly higher 39 per cent of all fatal crashes in Australia during the five-year period 2016 to 2020. Run-off road crashes form an important focus area in not only reducing total numbers of crashes but also the severity level of crashes.
Freight vehicle congestion in Australia’s five major cities – 2021
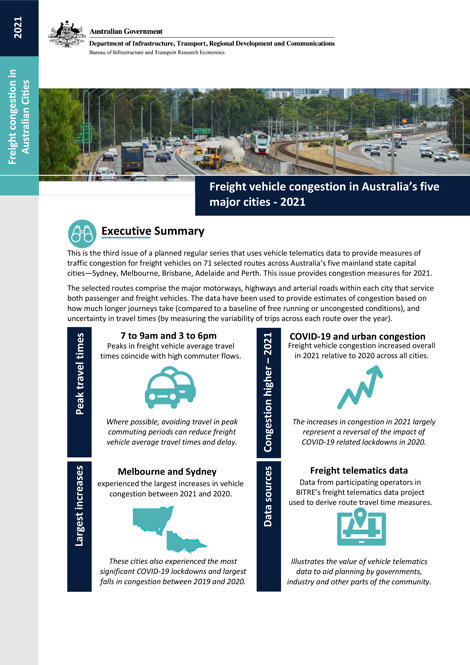
This publication is the third in the series that uses vehicle telematics data to provide measures of traffic congestion for freight vehicles for selected routes across Australia’s five mainland state capital cities—Sydney, Melbourne, Brisbane, Adelaide and Perth. The selected routes comprise the major motorways, highways and arterial roads within each city that service both passenger and freight vehicles. This release includes measures for 71 routes. The estimates presented in this report cover calendar year 2021, and include comparisons with 2020 traffic congestion levels.
The results show that freight vehicle congestion returned to pre-pandemic levels across all five mainland Australian capital cities in 2021, largely due to the return of commuter traffic in our cities, particularly during peak periods, following the impact of COVID-19 lockdowns in 2020. In particular, freight vehicle traffic congestion increases in 2021 were larger in Melbourne, and to a lesser extent Sydney, where lockdown-related reductions in congestion observed in 2020 were most significant. Relative to pre-COVID-19 congestion levels in 2019, freight vehicle congestion increases have been most significant in proportionate terms across Brisbane routes, even higher than experienced across Sydney and Melbourne routes. Brisbane routes also experienced the largest increases in average excess travel time variability (uncertainty) since 2019, greater than in Sydney and Melbourne. Copies of the data displayed in the report are available here and on data.gov.au.
Freight vehicle congestion in Australia’s five major cities – 2020
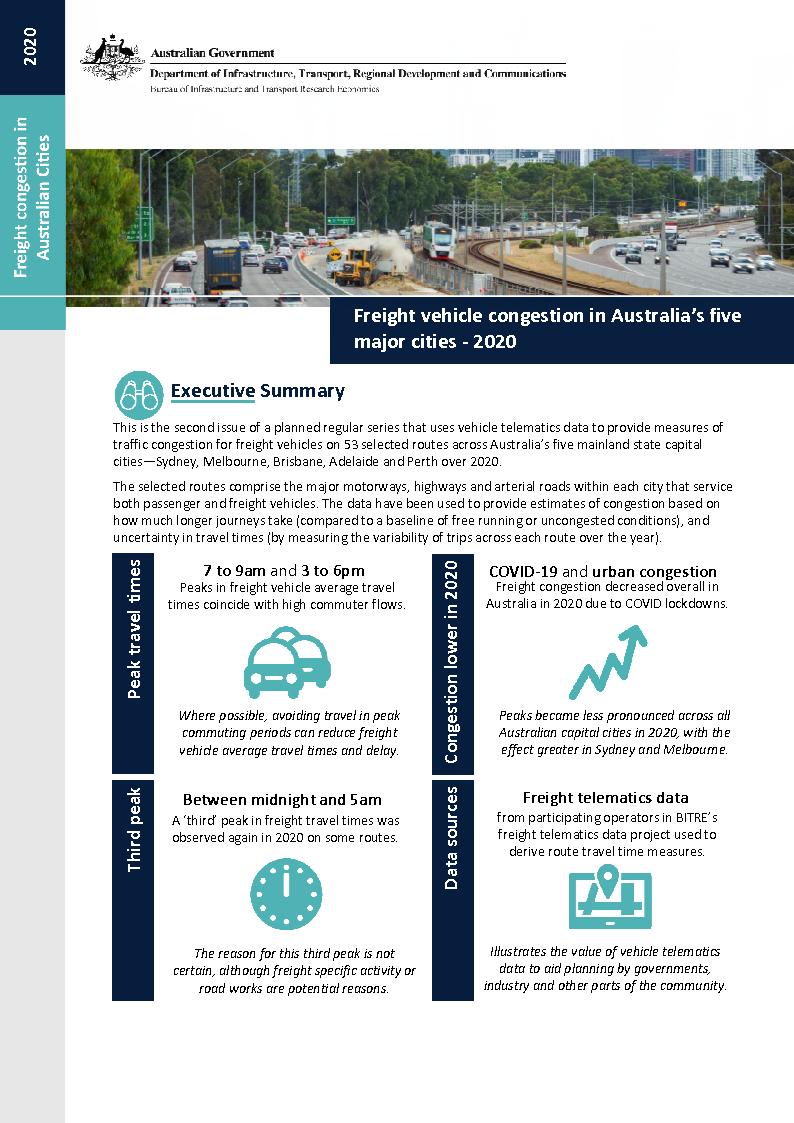
This publication is the second in a planned regular series that uses vehicle telematics data to provide measures of traffic congestion for freight vehicles on 53 selected routes across Australia’s five mainland state capital cities—Sydney, Melbourne, Brisbane, Adelaide and Perth. The selected routes comprise the major motorways, highways and arterial roads within each city that service both passenger and freight vehicles. The estimates presented in this report cover calendar year 2020, and includes a comparison with 2019 traffic congestion measures.
The results show that freight vehicle congestion decreased across all five mainland Australian capital cities in 2020, largely due to lower commuter activity on roads, particularly in peak periods, as a result of COVID-19 lockdowns. Whilst peak period travel times were less pronounced in 2020 across all cities, this effect was more significant in Sydney and Melbourne, because those cities had larger pre-COVID-19 traffic peaks and experienced longer lockdowns (particularly Melbourne), and less significant in other state capital cities. Copies of the data displayed in the report are available here and on data.gov.au.
Freight vehicle congestion in Australia’s five major cities - 2019

This publication is the first of a planned annual series that uses vehicle telematics data to provide measures of traffic congestion for freight vehicles on 53 selected routes across Australia’s five mainland state capital cities—Sydney, Melbourne, Brisbane, Adelaide and Perth. The selected routes comprise the major motorways, highways and arterial roads within each city that service both passenger and freight vehicles. The estimates presented in this report cover calendar year 2019.
The results show peaks in freight vehicle average travel times coincide with morning and evening peak commuter flows—for instance motorways tend to show morning peaks moving towards city CBDs and afternoon peaks moving away from it. Urban motorways exhibit more distinct travel time peak periods than non-motorway routes.
Australia’s light vehicle fleet - some insights
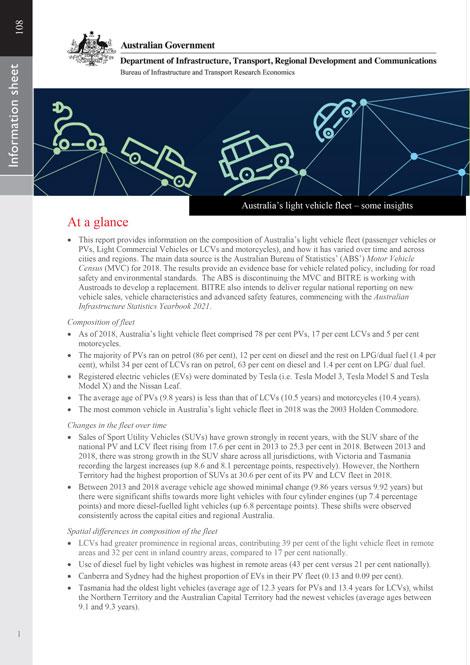
This Information Sheet investigates how the characteristics of Australia’s light vehicle fleet vary across different types of regions, including States/Territories, major cities, city sectors, region types, and small areas. Vehicle characteristics considered include fuel type, average age, cylinders and tare weight. Specific types of vehicles, such as electric vehicles, sports utility vehicles and utilities are also examined. The study also identifies recent changes in the composition of Australia’s light vehicle fleet.
Regional port catchments for road freight
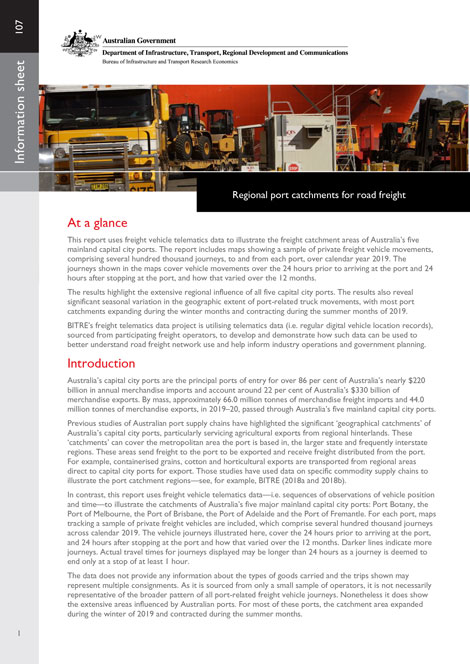
This Information Sheet uses freight vehicle telematics data to illustrate the freight catchment areas of Australia’s five mainland capital city ports. The report includes maps showing a sample of private freight vehicle movements, comprising several hundred thousand journeys, to and from each port, over calendar year 2019. The maps cover the 24 hours prior to arriving at the port and 24 hours after stopping at the port. The results highlight the extensive regional influence of all five capital city ports and also reveal significant seasonal variation in the geographic extent of port-related truck movements.