Australian Infrastructure and Transport Statistics Yearbook 2023 and Freight chapter
Chapter 4
Download data
Australian
This chapter focuses on Freight and explores the amount of goods moved in the Australian economy. The data from this chapter is sourced from BITRE’s Trainline and Australian Sea Freight publications, along with other unpublished estimates.
- Melbourne had the most metropolitan road fright estimated at 17.1 billion tonne‑kilometres in 2022‑23.
- NSW’s estimated road freight for 2022-23 was the highest on record at 84 billion tonne‑kilometres.
Figure 1 Australia’s Domestic freight, 2022-23
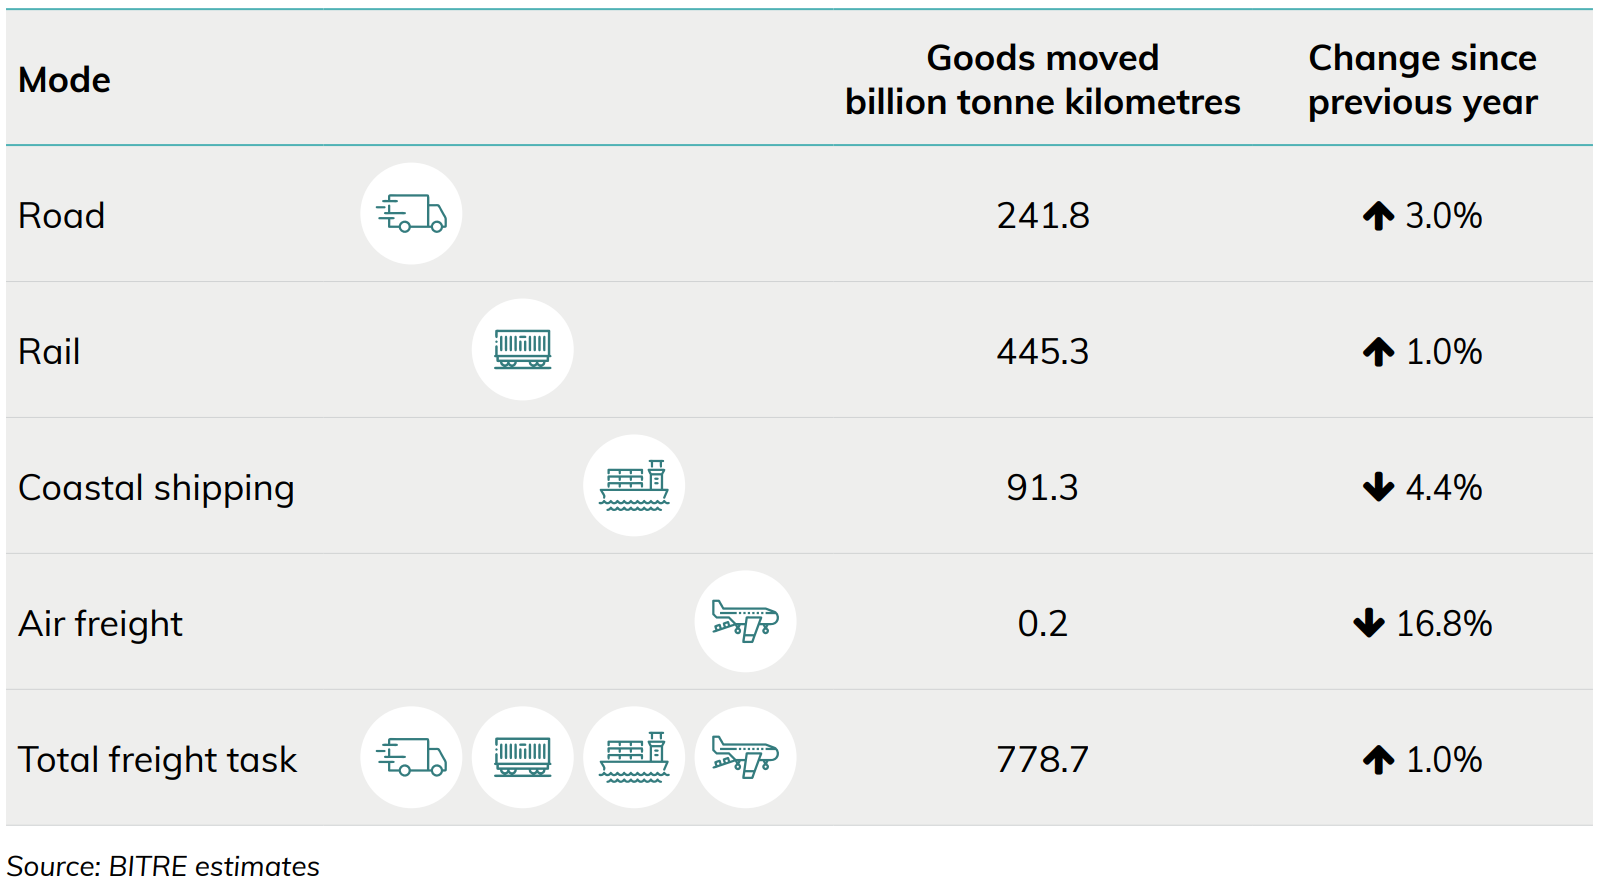
Freight transport activity (Figure 1) is measured in terms of tonne kilometres (the number of tonnes moved by a vehicle multiplied by the distance the load travelled in kilometres).
Figure 2 Australian domestic freight task, by mode of transport
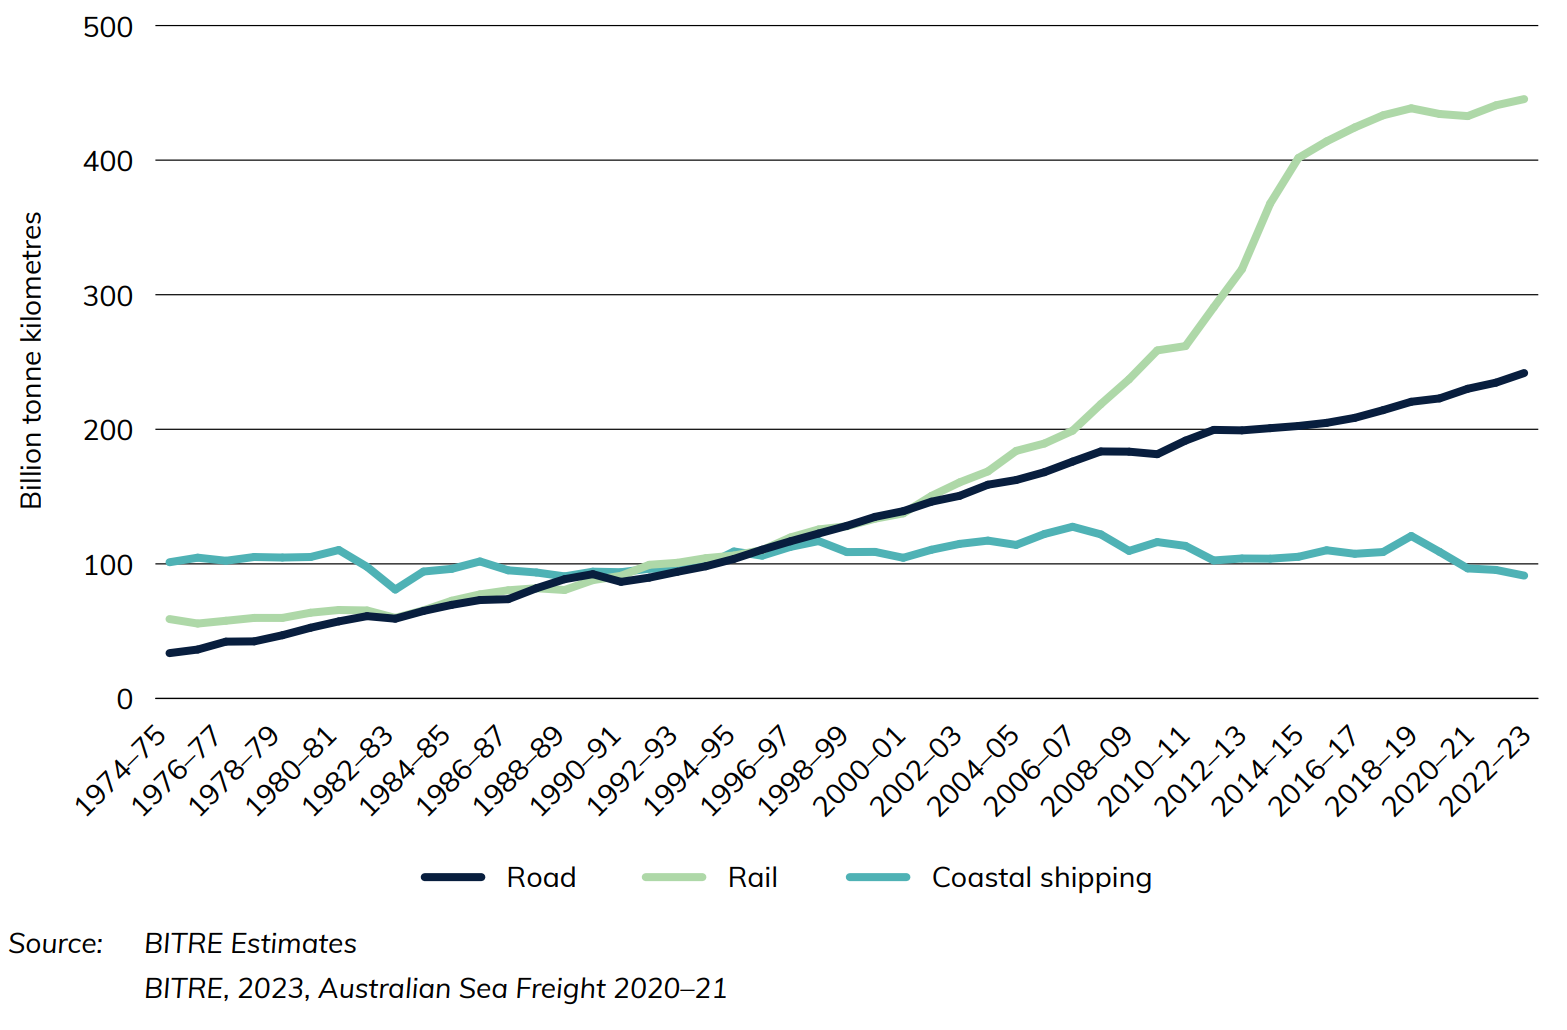
The Australian domestic freight task (Figure 2) has experienced strong growth over the last 40 years, with road and rail freight now dominating domestic freight activity. During the COVID-19 pandemic, the total bulk and non-bulk freight task fell slightly, from its height of 780.0 billion tkm in 2018-19 to 759.7 billion tkm in 2020-21. It has grown over the last two years, however, reaching its second-highest point in 2022-23 of 778.7 billion tkm.
Also see
Transport Energy and Environment
Chapter 11
This chapter provides information on the Australian measures of transport energy and the environment. Data is sourced from the Department of Climate Change, Energy, the Environment and Water’s petroleum statistics and BITRE estimates.
- Road vehicles made up 84 percent of full fuel cycle greenhouse gas emissions from all domestic transport modes in 2022-23, compared to 9 per cent from aviation.
- The national average price for petrol was 182.9 cents per litre in the 2022‑23 financial year.
- In 2022-23, domestic road vehicle full fuel cycle greenhouse gas emissions estimates (carbon dioxide equivalent) reached a record high level of 106 000 gigagrams of CO2 equivalent.
- In 2022-23, there was an estimated 56 billion litres of transport petroleum sold in Australia.
Figure 1 Selected refined petroleum products—Australian production
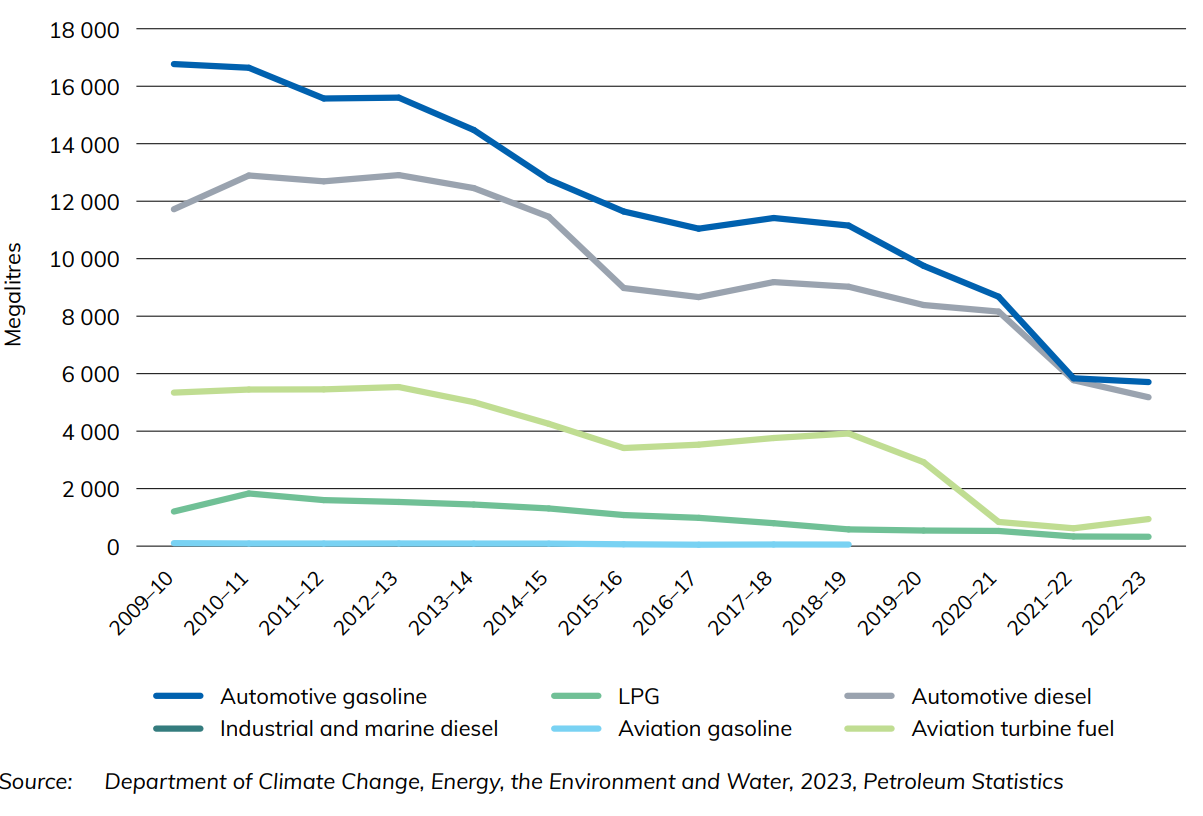
Figure 1 shows the change in production of selected refined petroleum products in Australia since 2009-10. It highlights how Australia’s production of these selected refined petroleum products is declining with time.
Figure 2 Selected refined petroleum products—imports to Australia

Figure 2 depicts the change in selected refined Australian petroleum imported for various transport industries as at June of each financial year.
Figure 3 Selected refined petroleum products—exports from Australia

Figure 3 shows the change in selected refined Australian petroleum exported for various transport industries as at June of each financial year.
Figure 4 Transport full fuel cycle greenhouse gas emissions
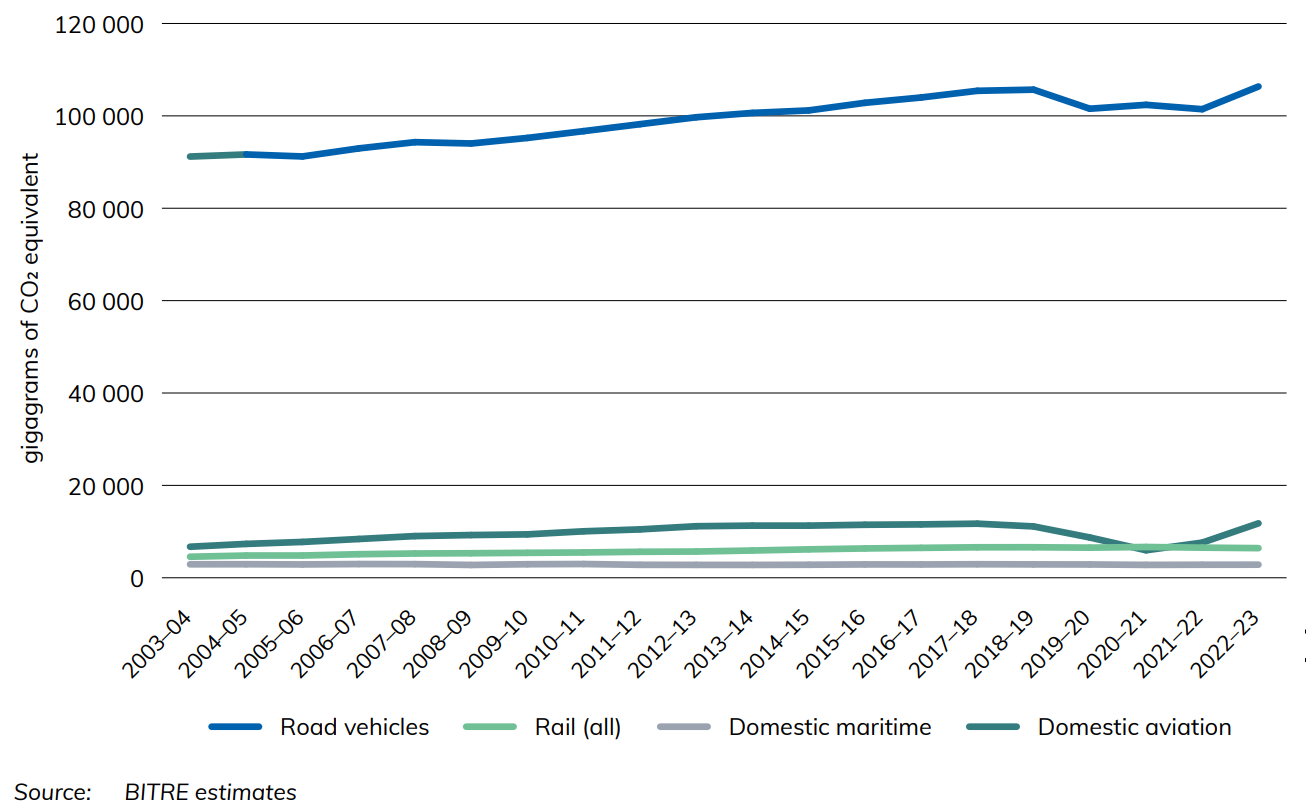
Figure 4 shows full fuel cycle greenhouse gas emissions by transport mode in gigagrams of CO2 equivalent. Transport emissions estimates in Australia have risen steadily since 1974-75, except over the COVID-19 pandemic period, which saw them dip temporarily for road vehicles and domestic aviation. Domestic aviation emissions were most affected, almost halving from 11 116 gigagrams of CO2 equivalent in 2018-19 to 5 955 gigagrams of CO2 equivalent in 2020-21, while road vehicle emissions fell by roughly 3 per cent over the same period. In 2022-23, estimates of emissions from domestic aviation and road vehicles both increased to their new highest levels, 11 784 and 106 355 gigagrams of CO2 equivalent respectively.
Download data
Also see
Tasmanian Freight Equalisation Scheme Monitoring Reports
The Tasmanian Freight Equalisation Scheme (TFES) provides financial assistance for cost incurred by shippers of eligible non-bulk goods moved by sea across the Bass Strait. More information about the operation of the Scheme can be found at Tasmanian Freight Equalisation Scheme | Department of Infrastructure, Transport, Regional Development, Communications and the Arts.
Under the TFES Ministerial Directions, BITRE provides a statistical report on all components of the Scheme every four years. The Monitoring Reports and other reports related to the scheme are linked below.
Monitoring Reports
- Tasmanian Freight Equalisation Scheme Monitoring Report 2024
- Consultation Draft Tasmanian Freight Equalisation Scheme Monitoring Report 2024
- Monitoring report 2020 Tasmanian Freight Equalisation Scheme
Other Reports
- Tasmanian Freight Equalisation Scheme - Review of the expanded component: Final Report (2018)
- Tasmanian Freight Equalisation Scheme: A 'Landbridge' Approach to the Estimation of Subsidy Rates (1981)
- Tasmanian Freight Equalisation Scheme: Recommended Rates of Assistance for Southbound Cargoes, Livestock and Timber at 31 January 1979
- Tasmanian Freight Equalisation Scheme: Recommended Northbound Assistance Rates at 1 January 1978
- Tasmanian Freight Equalisation Scheme: Discussion Paper September 1996
Tasmanian Freight Schemes Parameter Reviews
Chapter 9: shipping
Download data
- Shipping—Yearbook 2024 (136 KB) - Download Excel file
- Australian Infrastructure and Transport Statistics—Yearbook 2024 - Download PDF
This chapter provides information on Australian ships, cargo, ports and fleet including mileage, tonnage and number of vessels. The data is sourced from BITRE's Australian Sea Freight publication, BITRE's Waterline publication and BITRE estimates based on Lloyds List Intelligence Data.
- There were 53 Australian registered vessels in the Australian trading fleet, including small vessels, and 83 overseas registered vessels in 2022–23.
- Queensland had the largest discharged volume with 40 million tonnes in 2020–21. Following Queensland was New South Wales and Victoria with 33 million tonnes discharged each.
- Western Australian ports loaded 1 billion tonnes of maritime cargo in 2020–21, the largest volume in Australia. Next, Queensland and New South Wales loaded 289 million tonnes and 176 million tonnes respectively. Together the ports in these 3 states loaded 94% of Australia's maritime cargo by volume in 2020–21.
- 8.6 million TEUs (twenty-foot equivalent units) were exchanged at container terminals in Brisbane, Sydney, Melbourne, Fremantle and Adelaide in 2022–23.
Figure 19 Principal Australian ports, by commodity
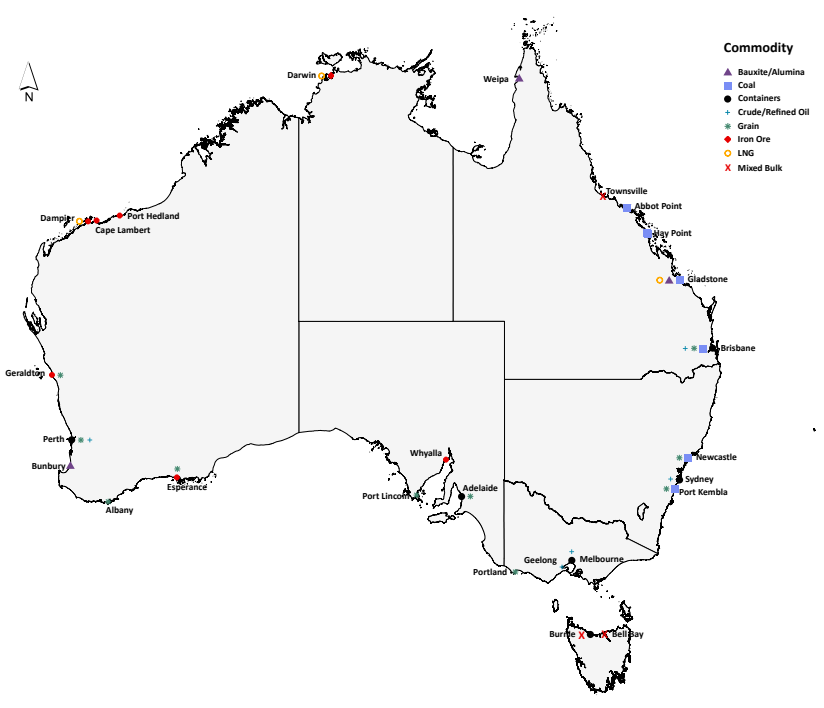
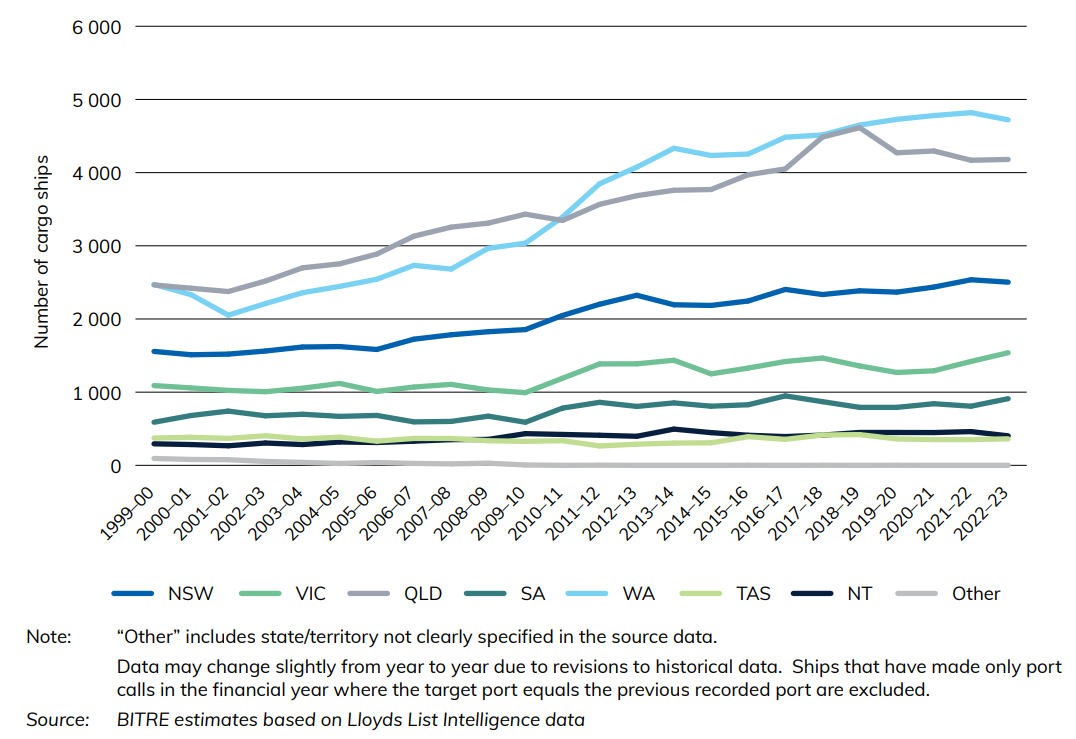
Figure 20 provides a state breakdown of the number of cargo ships on coastal or international voyages that made port calls from 1999-00 to 2022-23. The majority of states saw increases during this time period. Queensland and Western Australia experienced the largest numerical increases and were consistently Australia's 2 most-visited states by cargo ships.
Figure 20 Number of cargo ships involved in coastal or international voyages that made port calls, by state/territory
Also see
Regional port catchments for road freight
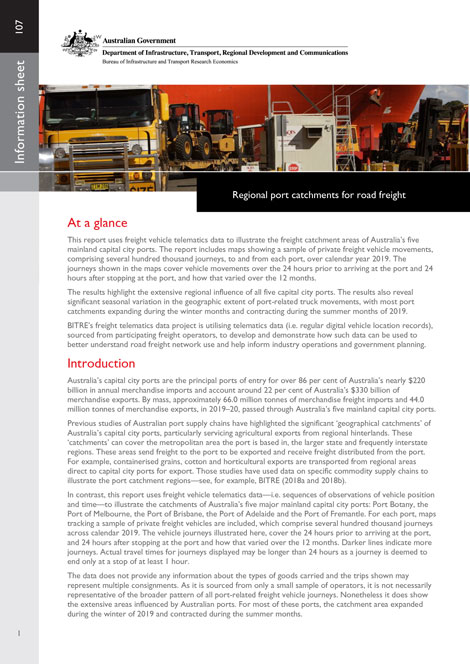
This Information Sheet uses freight vehicle telematics data to illustrate the freight catchment areas of Australia’s five mainland capital city ports. The report includes maps showing a sample of private freight vehicle movements, comprising several hundred thousand journeys, to and from each port, over calendar year 2019. The maps cover the 24 hours prior to arriving at the port and 24 hours after stopping at the port. The results highlight the extensive regional influence of all five capital city ports and also reveal significant seasonal variation in the geographic extent of port-related truck movements.
Freight Data Exchange pilot projects—Summary Report 2020
Information technology and data are increasingly essential to modern business operations. The increasing digitalisation of supply chain processes and freight consignment information offers further opportunities to increase the efficiency and productivity of Australian freight supply chains.
For industry, increasing digitalisation can improve visibility of freight consignments and interoperability between supply chain partners, and aid industry in responding to supply chain delays, bottlenecks or errors – and thereby improve overall freight industry efficiency and productivity. For governments and transport planning agencies, the increasing digitalisation of freight supply chain information can potentially provide more timely strategic-level information to help inform planning and investment, and at less cost.
In 2019-20, the Australian Government, in cooperation with iMOVE and selected industry partners, undertook an initial round of Freight Data Exchange pilot projects to investigate, develop and demonstrate the capability for supply chain partners to share freight consignment information in real time and also assess the feasibility of aggregating freight consignment event/message data to produce aggregate outputs that help inform infrastructure planning and policy priorities.
This report briefly outlines some of the key outcomes of the three projects and suggests directions for further work.
The report was produced in collaboration between BITRE and iMOVE Australia, and with the support and assistance of participating industry partners.
Freight route performance under COVID-19
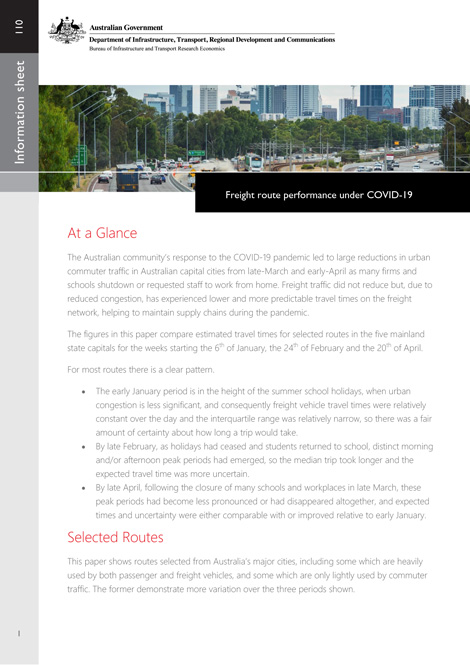
This Information Sheet provides estimates of the impact of the COVID-19 pandemic on freight vehicle travel times for selected routes in Australian major cities in early 2020. The results show that whilst there was no significant change in freight vehicle traffic volumes over that period, freight vehicles experienced shorter and more predictable travel times on many urban freight routes, primarily due to reduced commuting trips. This helped the freight industry to maintain supply chains during the initial stages of the pandemic. The data underlying the estimates is from the BITRE freight telematics program collection, which is sourcing vehicle position data from a small number of road freight operators.
- Freight route performance under COVID-19
Freightline 7—Australian aluminium industry freight transport
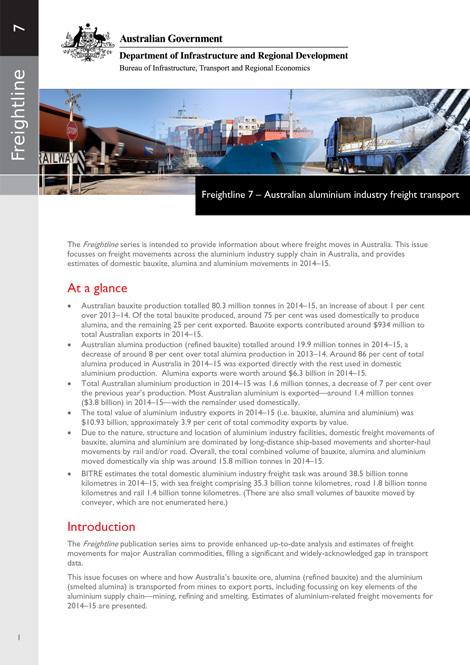
The Freightline series is intended to provide information on interregional freight movements across Australia, filling a major gap in Australian transport-related data and information, to help better inform and support policy development and infrastructure planning. Freightline 1 provides a broad overview of the freight task. Subsequent issues consider specific commodity freight tasks, and include more detailed information about the size and location of major freight movements, supply chain composition and key infrastructure components.
This issue (Freightline 7) focusses on Australian aluminium industry transport supply chains and freight movements in 2014–15.
- Freightline 7–Australian aluminium industry freight transport
Freightline 6—Australian rice freight transport
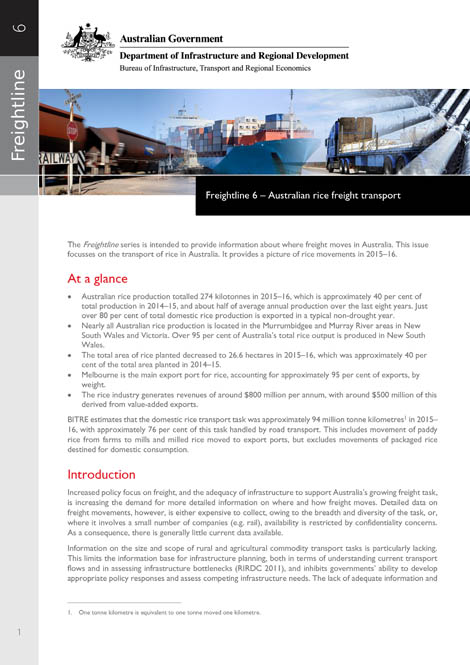
The Freightline series is intended to provide information on interregional freight movements across Australia, filling a major gap in Australian transport-related data and information, to help better inform and support policy development and infrastructure planning. Freightline 1 provides a broad overview of the freight task. Subsequent issues consider specific commodity freight tasks, and include more detailed information about the size and location of major freight movements, supply chain composition and key infrastructure components. This issue (Freightline 6) focusses on Australian rice transport supply chains and freight movements in 2015–16.
- Freightline 6–Australian rice freight transport
Freightline 5—Australian cotton freight transport
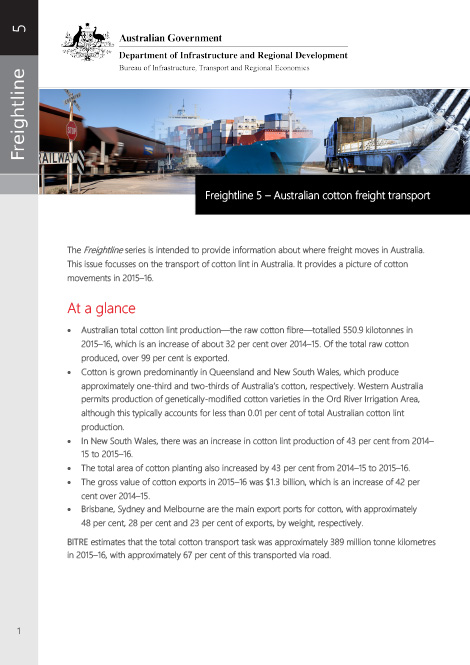
The Freightline series is intended to provide information on interregional freight movements across Australia, filling a major gap in Australian transport-related data and information, to help better inform and support policy development and infrastructure planning. Freightline 1 provides a broad overview of the freight task. Subsequent issues consider specific commodity freight tasks, and include more detailed information about the size and location of major freight movements, supply chain composition and key infrastructure components. This issue (Freightline 5) focusses on Australian cotton transport supply chains and freight movements in 2015–16.
- Freightline 5–Australian cotton freight transport