
Cost of Aviation Accidents and Incidents
This report provides estimates of the total cost to Australia of aviation related accidents and incidents that occurred in the financial year 2003–04. It also reports the cost per accident and the cost attributable to a fatality. It is an update of Cost of Civil Aviation Accidents and Incidents published by the Bureau of Transport Economics in 1998, which estimated costs for 1996.
- Cost of Aviation Accidents and Incidents
Previous issues of Avline have examined Australian domestic and regional aviation. The feature article in this issue focuses on the international sector of the Australian aviation industry which is currently operating at record levels–with more than 21 million passengers carried on flights to or from Australia during 2005.
- Avline No 8–June 2006
Australian Transport Statistics 2006
Australian Transport Statistics provides an easy introduction to a diverse range of transport statistics. Topics include employment, GDP, passenger and freight movements, trade, funding, motor vehicles, fatalities and estimated greenhouse gas emissions attributed to the transport industry. Various international comparisons are included and details provided for the road, rail, marine and aviation sectors. Data are gathered from various sources within the Bureau of Transport and Regional Economics and from external organisations.
It highlights the variation in aircraft and passenger traffic during this period and discusses how the operational profile has changed through the introduction of discount flights and more direct services to regional centres.
- Avline No 9–May 2007
The feature article examines the operational changes in terms of passenger traffic and aircraft movements at Australia's five major airports (Sydney, Melbourne, Brisbane, Adelaide and Perth) over the decade 1997–2006. Total passengers passing through all five airports grew by 55% over the decade while total aircraft movements displayed a marginal decrease.
- Avline No 10–August 2007
International Freight to/from Australia
The Excel file below contains tables showing the value and weight of Australian international imports and exports each quarter, by sea freight (liner and non-liner) and by air. The time series covers the period from 3rd quarter 1984 to the 1st quarter 2007.
The Bureau of Transport and Regional Economics has taken due care in preparing the analyses contained in these tables. However, noting that data used for the analyses have been provided by third parties, the Commonwealth gives no warranty to the accuracy, reliability, fitness for purpose, or otherwise of the information.
- International Freight to/from Australia

The feature article examines the aviation industry's contribution to greenhouse gas emissions and the steps being taken both domestically and internationally to quantify the problem and to reduce aviation emissions.
The number of passengers on Australian international flights has increased to 22.3 million in 2006–07, up 4.7 per cent on the previous year. Growth is driven mainly by Australian residents travelling overseas rather than the arrival of international visitors. The number of international flights has also increased by 1.3 per cent to 119 271.
Australia's domestic airline industry continues to operate at high levels with a record 45.3 million passengers carried in 2006–07, 6.0 per cent higher than 2005–06 . The major domestic airlines carried 39.8 million passengers, an increase of 8.0 per cent over 2005–06. Regional airlines carried 5.51 million passengers, an increase of 10.8 per cent over the previous year.
- Avline No. 11–January 2008
Australian Transport Statistics Yearbook 2007
Australian Transport Statistics provides a short summary of a diverse range of transport statistics. Topics include employment, GDP, passenger and freight movements, trade, funding, motor vehicles, fatalities and estimated greenhouse gas emissions attributed to the transport industry. Information is provided for the road, rail, maritime and aviation sectors. Data are gathered from various sources both within BTRE and external organisations.
- Australian Transport Statistics Yearbook 2007
- Australian Transport Statistics Yearbook 2007–Spreadsheets

Air passenger movements through capital city airports to 2025–26
This report presents the forecasts of passenger and aircraft traffic at capital city airports over the next 20 years. The forecasts have been developed on the basis of the estimated econometric models of passenger demand and the most recent economic outlook for Australia and its major trading partners. Australia's eight capital city airports (Adelaide, Brisbane, Canberra, Darwin, Hobart, Melbourne, Perth and Sydney) are included in the development of the forecasts. The report has been updated to 2029–30 in Aircraft movements through capital city airports to 2029–30 in Research report 117.
- Air passenger movements through capital city airports to 2025–26
Australian Transport Statistics 2008—pocket booklet
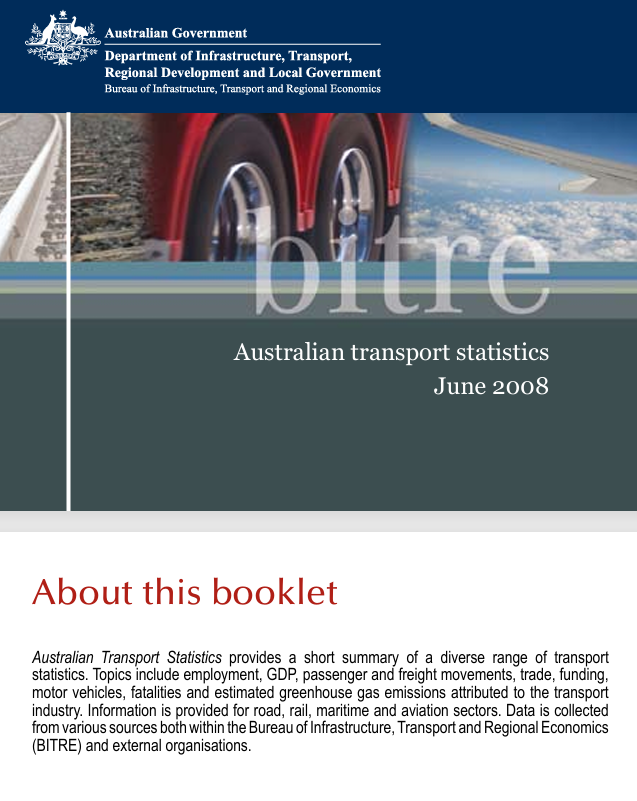
Australian Transport Statistics provides a short summary of a diverse range of transport statistics. Topics include employment, GDP, passenger and freight movements, trade, funding, motor vehicles, fatalities and estimated greenhouse gas emissions attributed to the transport industry.