Domestic aviation activity—cities and regions
Below is a summary analysis of data from Regular Public Transport Domestic Aviation Activity in Australia by route type. The data file is available further down this page.
Summary—2025-26
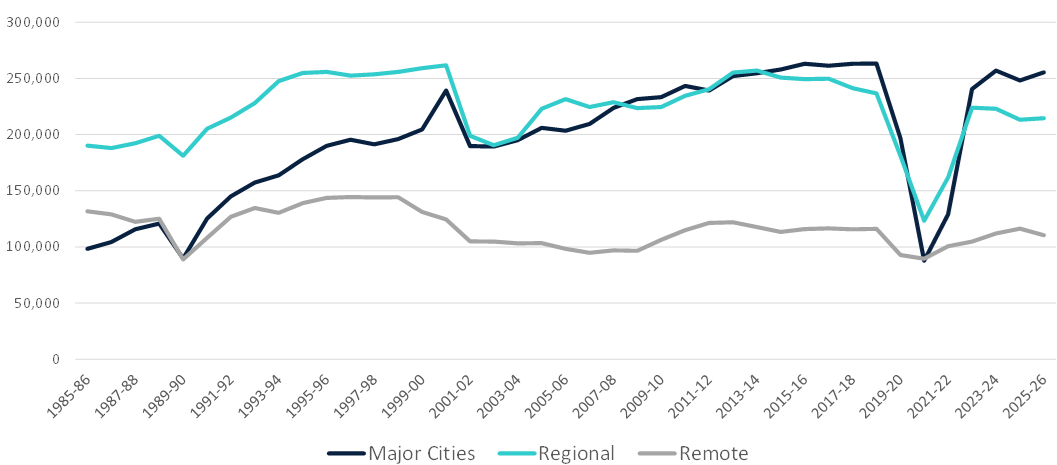
Flights by route type
Flights on Regional and Remote routes combined dropped from 329,593 in 2024-25 to 325,063 in 2025-26 – a decrease of 1.4 per cent. Over the same period, flights between airports located in Major Cities increased from 248,206 to 255,570 - an increase of 3.0 per cent.
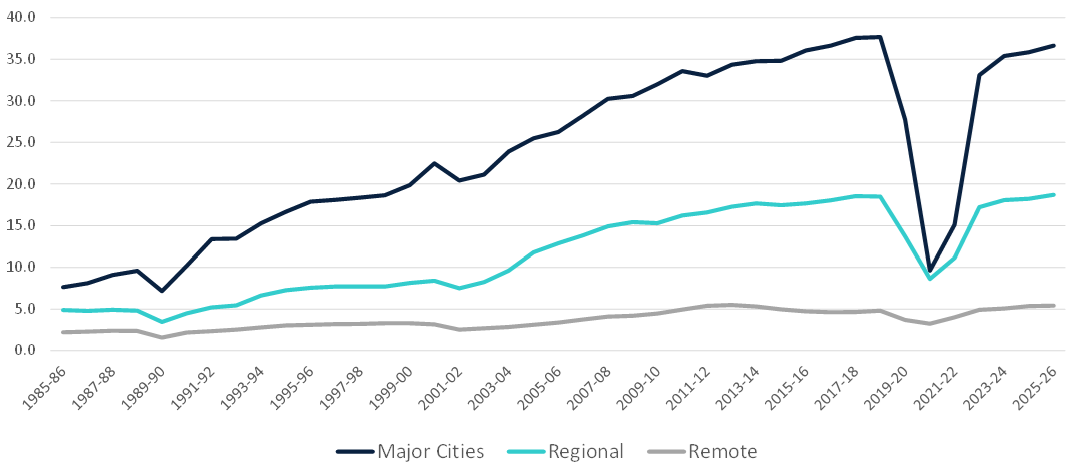
Passengers (millions) by route type
Passengers on Regional and Remote routes combined increased from 23.6 million in 2024-25 to 24.1 million in 2025-26 - an increase of 2.2 per cent. Over the same period, passengers carried between airports located in Major Cities increased from 35.8 million to 36.6 million - an increase of 2.2 per cent.
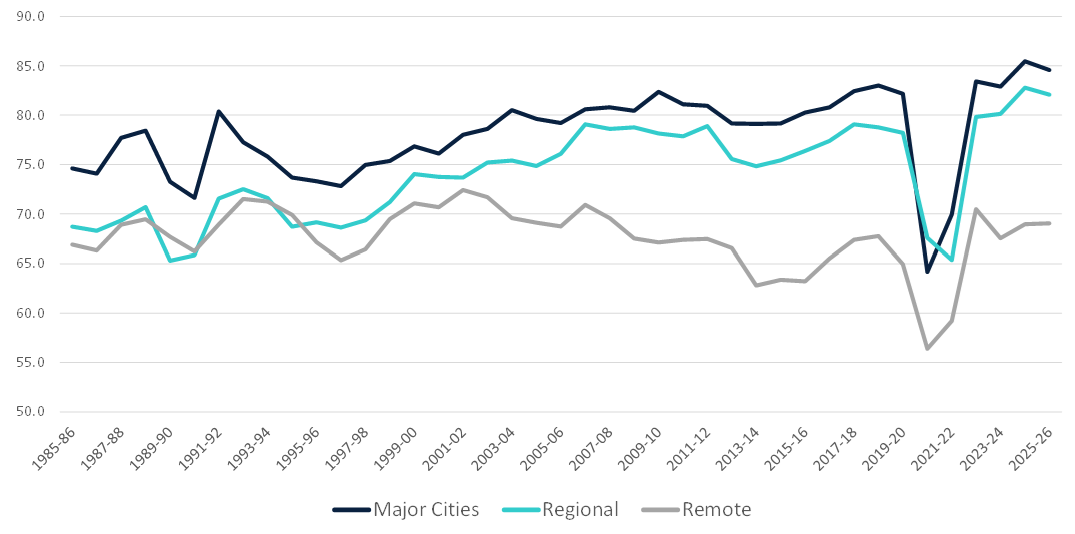
Load factors (RPKs/ASKs as a percentage) by route type
Load factor on Regional and Remote routes combined decrease from 79.1 per cent in 2024-25 to 78.7 per cent in 2025-26. Over the same period, the load factor on flights between Major cities decreased from 85.5 per cent to 84.6 per cent.
Data file
Data notes
This file provides data on Regular Public Transport (RPT) Domestic Aviation Activity in Australia by sector type.
Each sector is classified using the ABS Australian Statistical Geography Standard (ASGS) 2016 based on location of the airport pair.
‘Major Cities’ covers sectors between 2 airports located in Major Cities, ‘Regional’ covers sectors where at least one airport is in an Inner Regional or Outer Regional area, but no airports are in Remote or Very remote areas and ‘Remote’ covers sectors where at least one airport is in a Remote or Very Remote location.
Data are provided for Flights, Passenger trips, Seats, Revenue Passenger Kilometres (RPKs), Available Seat Kilometres (ASKs), Distance flown, Load factors (RPKs/ASKs), Distance per flight, Seats per flight, Number of operators and Number of sectors.
Raw data is available in the sheet called “Data”. Use the sheet called “Chart” to select a metric and see it as a chart. More information and definitions are provided in the sheet called “Notes”.