International airline activity
Summary
Sixty-two international airlines operated scheduled services to/from Australia during the month (includes 3 dedicated freight airlines but excludes airlines operating only via codeshare arrangements).
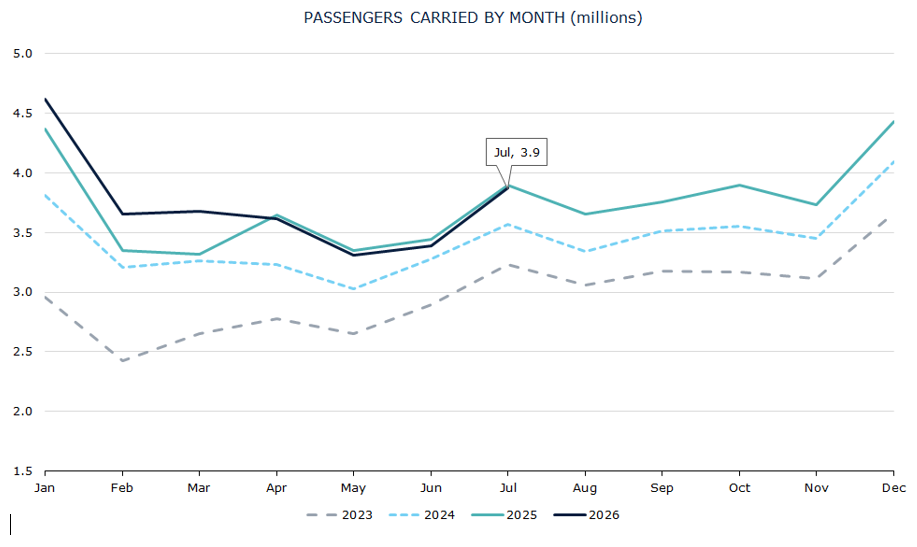
International scheduled passenger traffic in July 2026 was 3.873 million compared with 3.896 million in July 2025, representing a decrease of 0.6%. This is the fourth consecutive monthly year-on-year decline since the first decrease recorded in April 2026. Prior to these recent declines the last monthly year-on-year decrease occurred in October 2021 (COVID).
Passenger traffic for the year ended July 2026 was 45.624 million which is a 5.3% increase over the figure for the year ended July 2025 (43.336 million).
Total seats made available on international scheduled operations to/from Australia during July 2026 were 4.843 million – an increase of 2.0% compared with July 2025. The overall seat utilisation percentage was 82.0% in July 2026. It was 83.7% in July 2025 and 83.3% in July 2024.
In terms of passenger carriage, Qantas Airways had the largest share of the market in July 2026 with 16.4% of the total followed by Jetstar with 14.1%, Singapore Airlines with 8.8%, Air New Zealand with 6.5% and Virgin Australia with 4.6%.
The Qantas Group (Qantas Airways and Jetstar) accounted for 30.5% of total passenger carriage in July 2026. The group’s share was 28.8% in July 2025 and 28.2% in July 2024.
Australian designated airlines (Qantas Airways, Jetstar and Virgin Australia) accounted for 35.1% of total passenger carriage in July 2026. Their share was 33.4% in July 2025 and 31.6% in July 2024.
Low-cost carriers (LCCs) AirAsia Berhad, AirAsia X, Cebu Pacific Air, Indonesia AirAsia, Jetstar, Scoot, T’Way Air and Vietjet Air accounted for 20.9% of total international passenger traffic to/from Australia in July 2026. The LCCs’ share in July 2025 was 20.7% and 20.5% in July 2024.
International scheduled freight traffic in July 2026 increased by 6.8% over July 2025 to 93,318 tonnes. Inbound freight traffic increased by 9.3% and outbound freight traffic increased by 2.1% compared with July 2025.
Freight traffic for the year ended July 2026 was 1.108 million tonnes - a decrease of 0.6% compared with the year ended July 2025 (1.115 million tonnes).
Summary of year-on-year activity
| Year ended July 2025 | Year ended July 2026 | % Change | |
|---|---|---|---|
| Total passenger movements (million) | 43.336 | 45.624 | 5.2 |
Summary of month-on-month activity
| July 2025 | July 2026 | % Change | |
|---|---|---|---|
| Passengers carried (million) | 3.896 | 3.873 | -0.6 |
| Freight (tonnes) | 87 337 | 93 318 | 6.8 |
| Mail (tonnes) | 2 110 | 2 126 | 0.8 |
| Available Seats (million) | 4.746 | 4.843 | 2.0 |
| Flights | 18 664 | 19 208 | 2.9 |
| Aircraft Movements | 19 130 | 19 542 | 2.2 |