Domestic aviation activity
Information and data on domestic aviation can be found at the following links.
- Australian domestic aviation activity—time series
- Australian domestic aviation activity—monthly publications
- Australian domestic aviation activity—annual publications
- Domestic aviation activity—Cities and Regions
Below are graphs and summary analysis relating to domestic aviation activity.
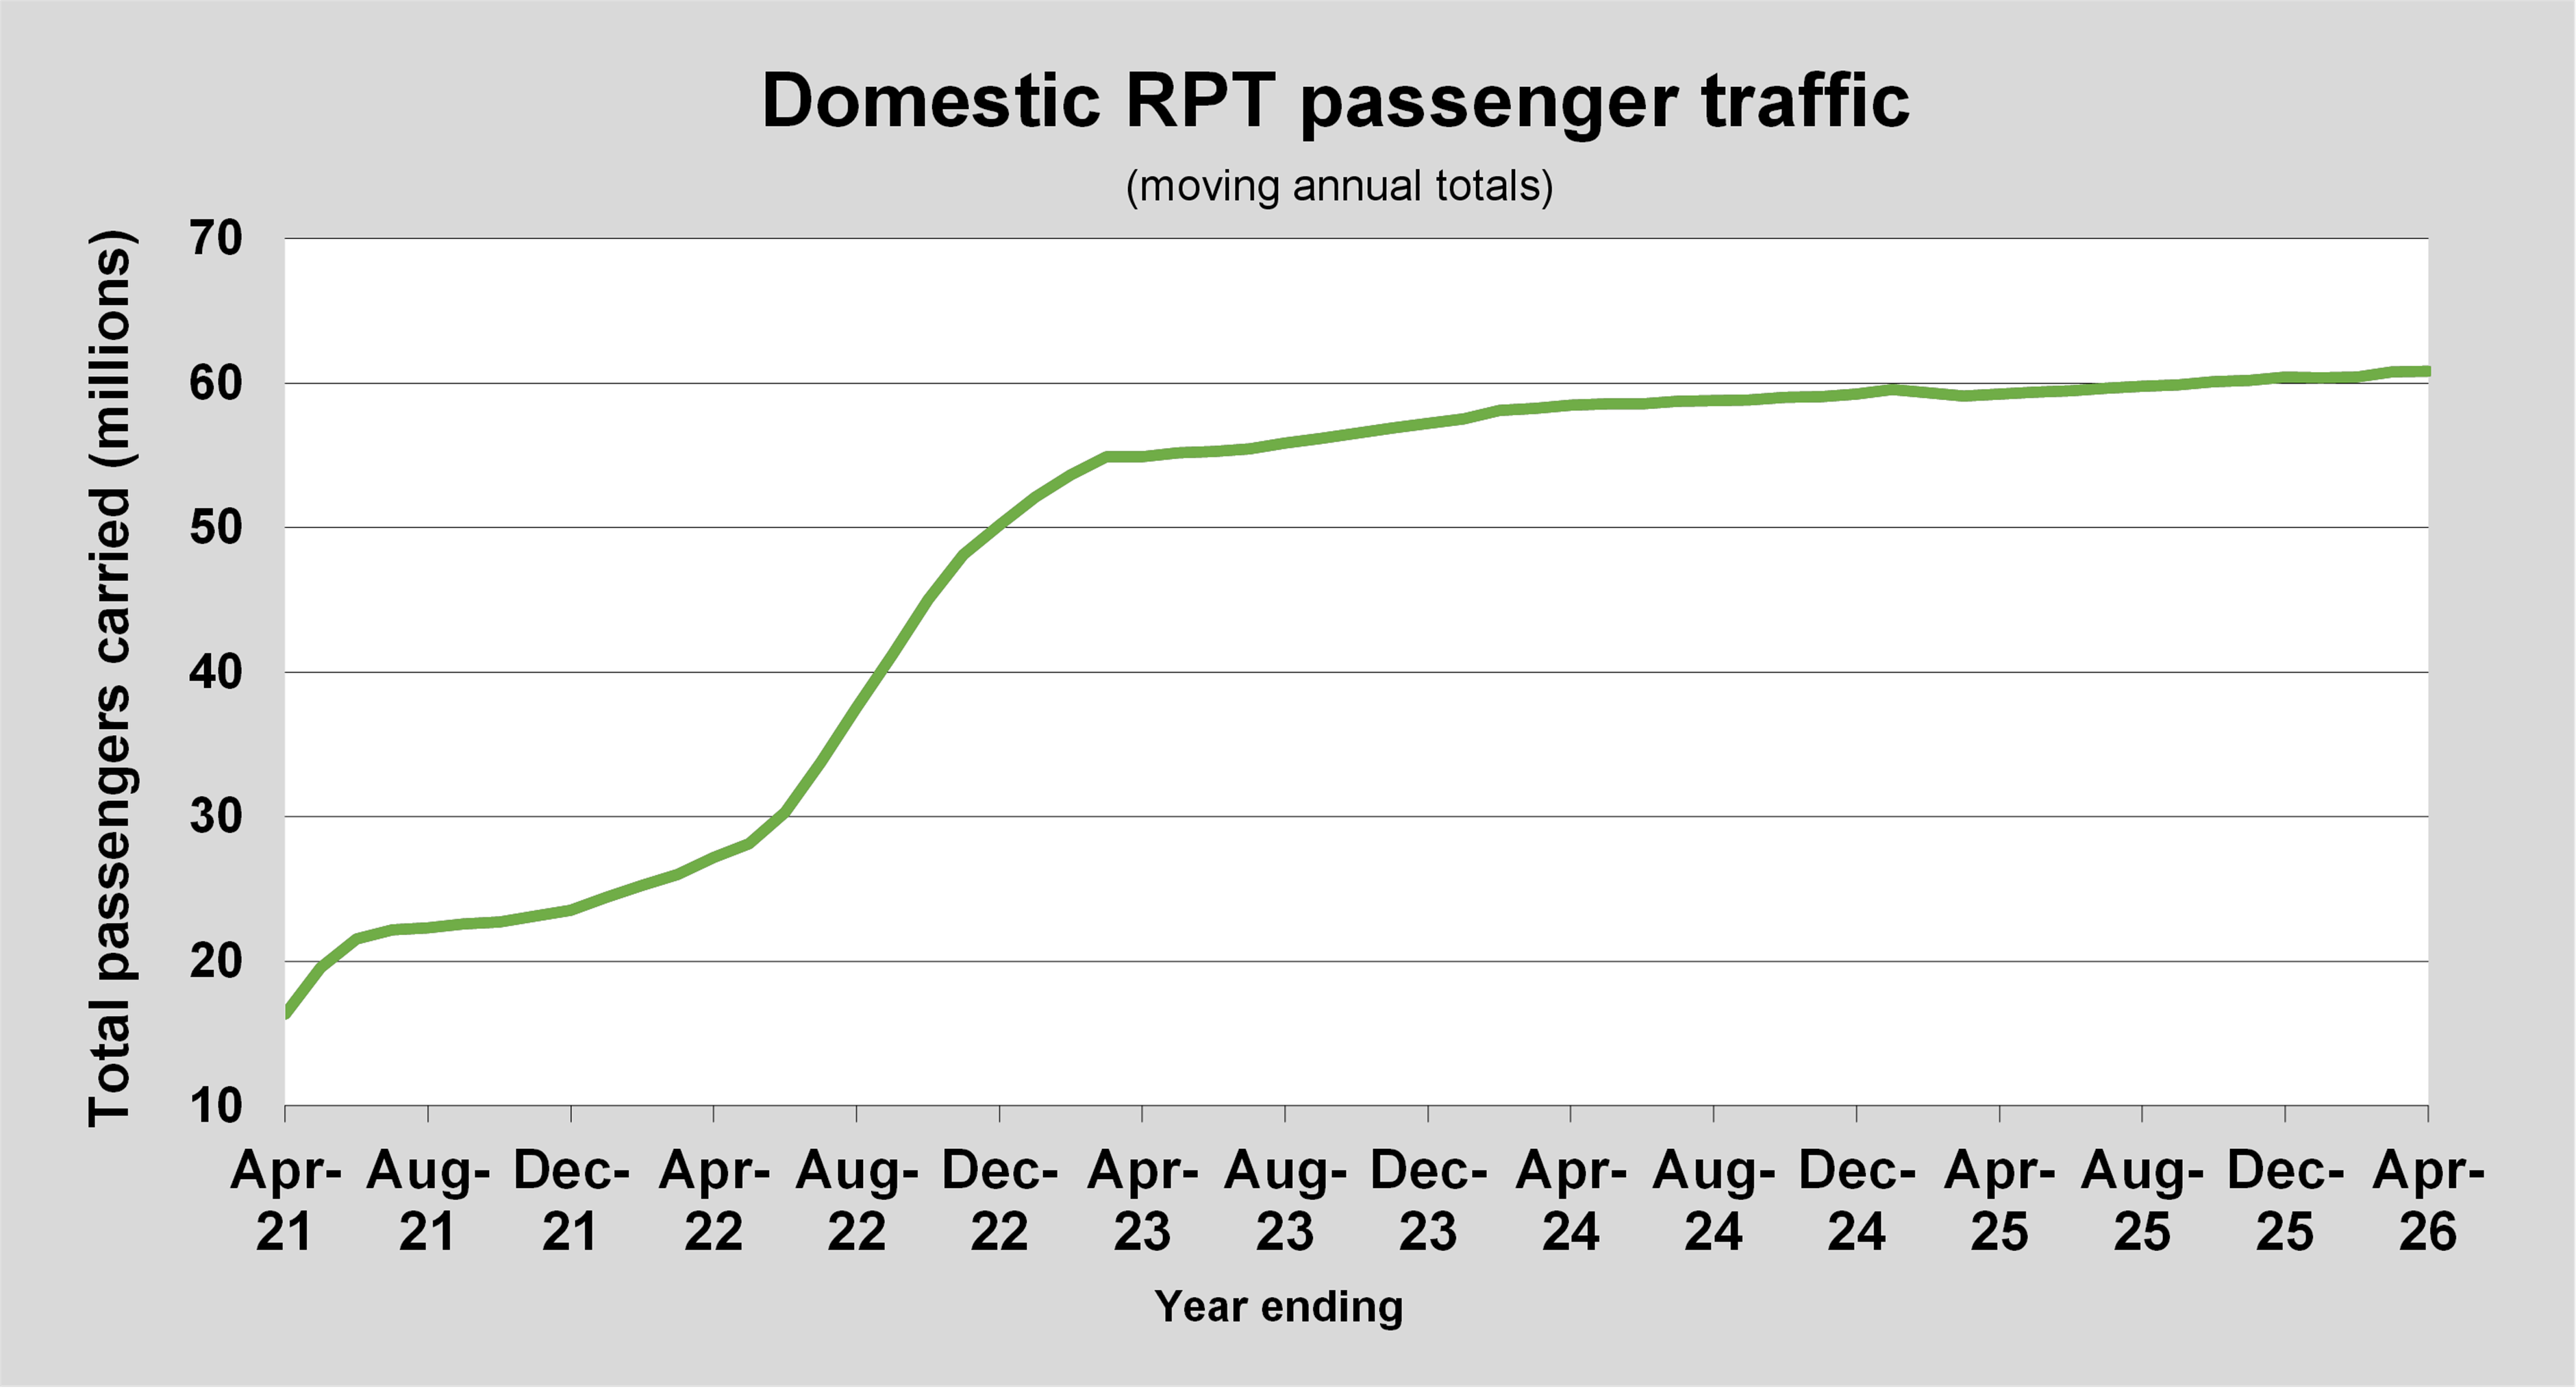
Summary
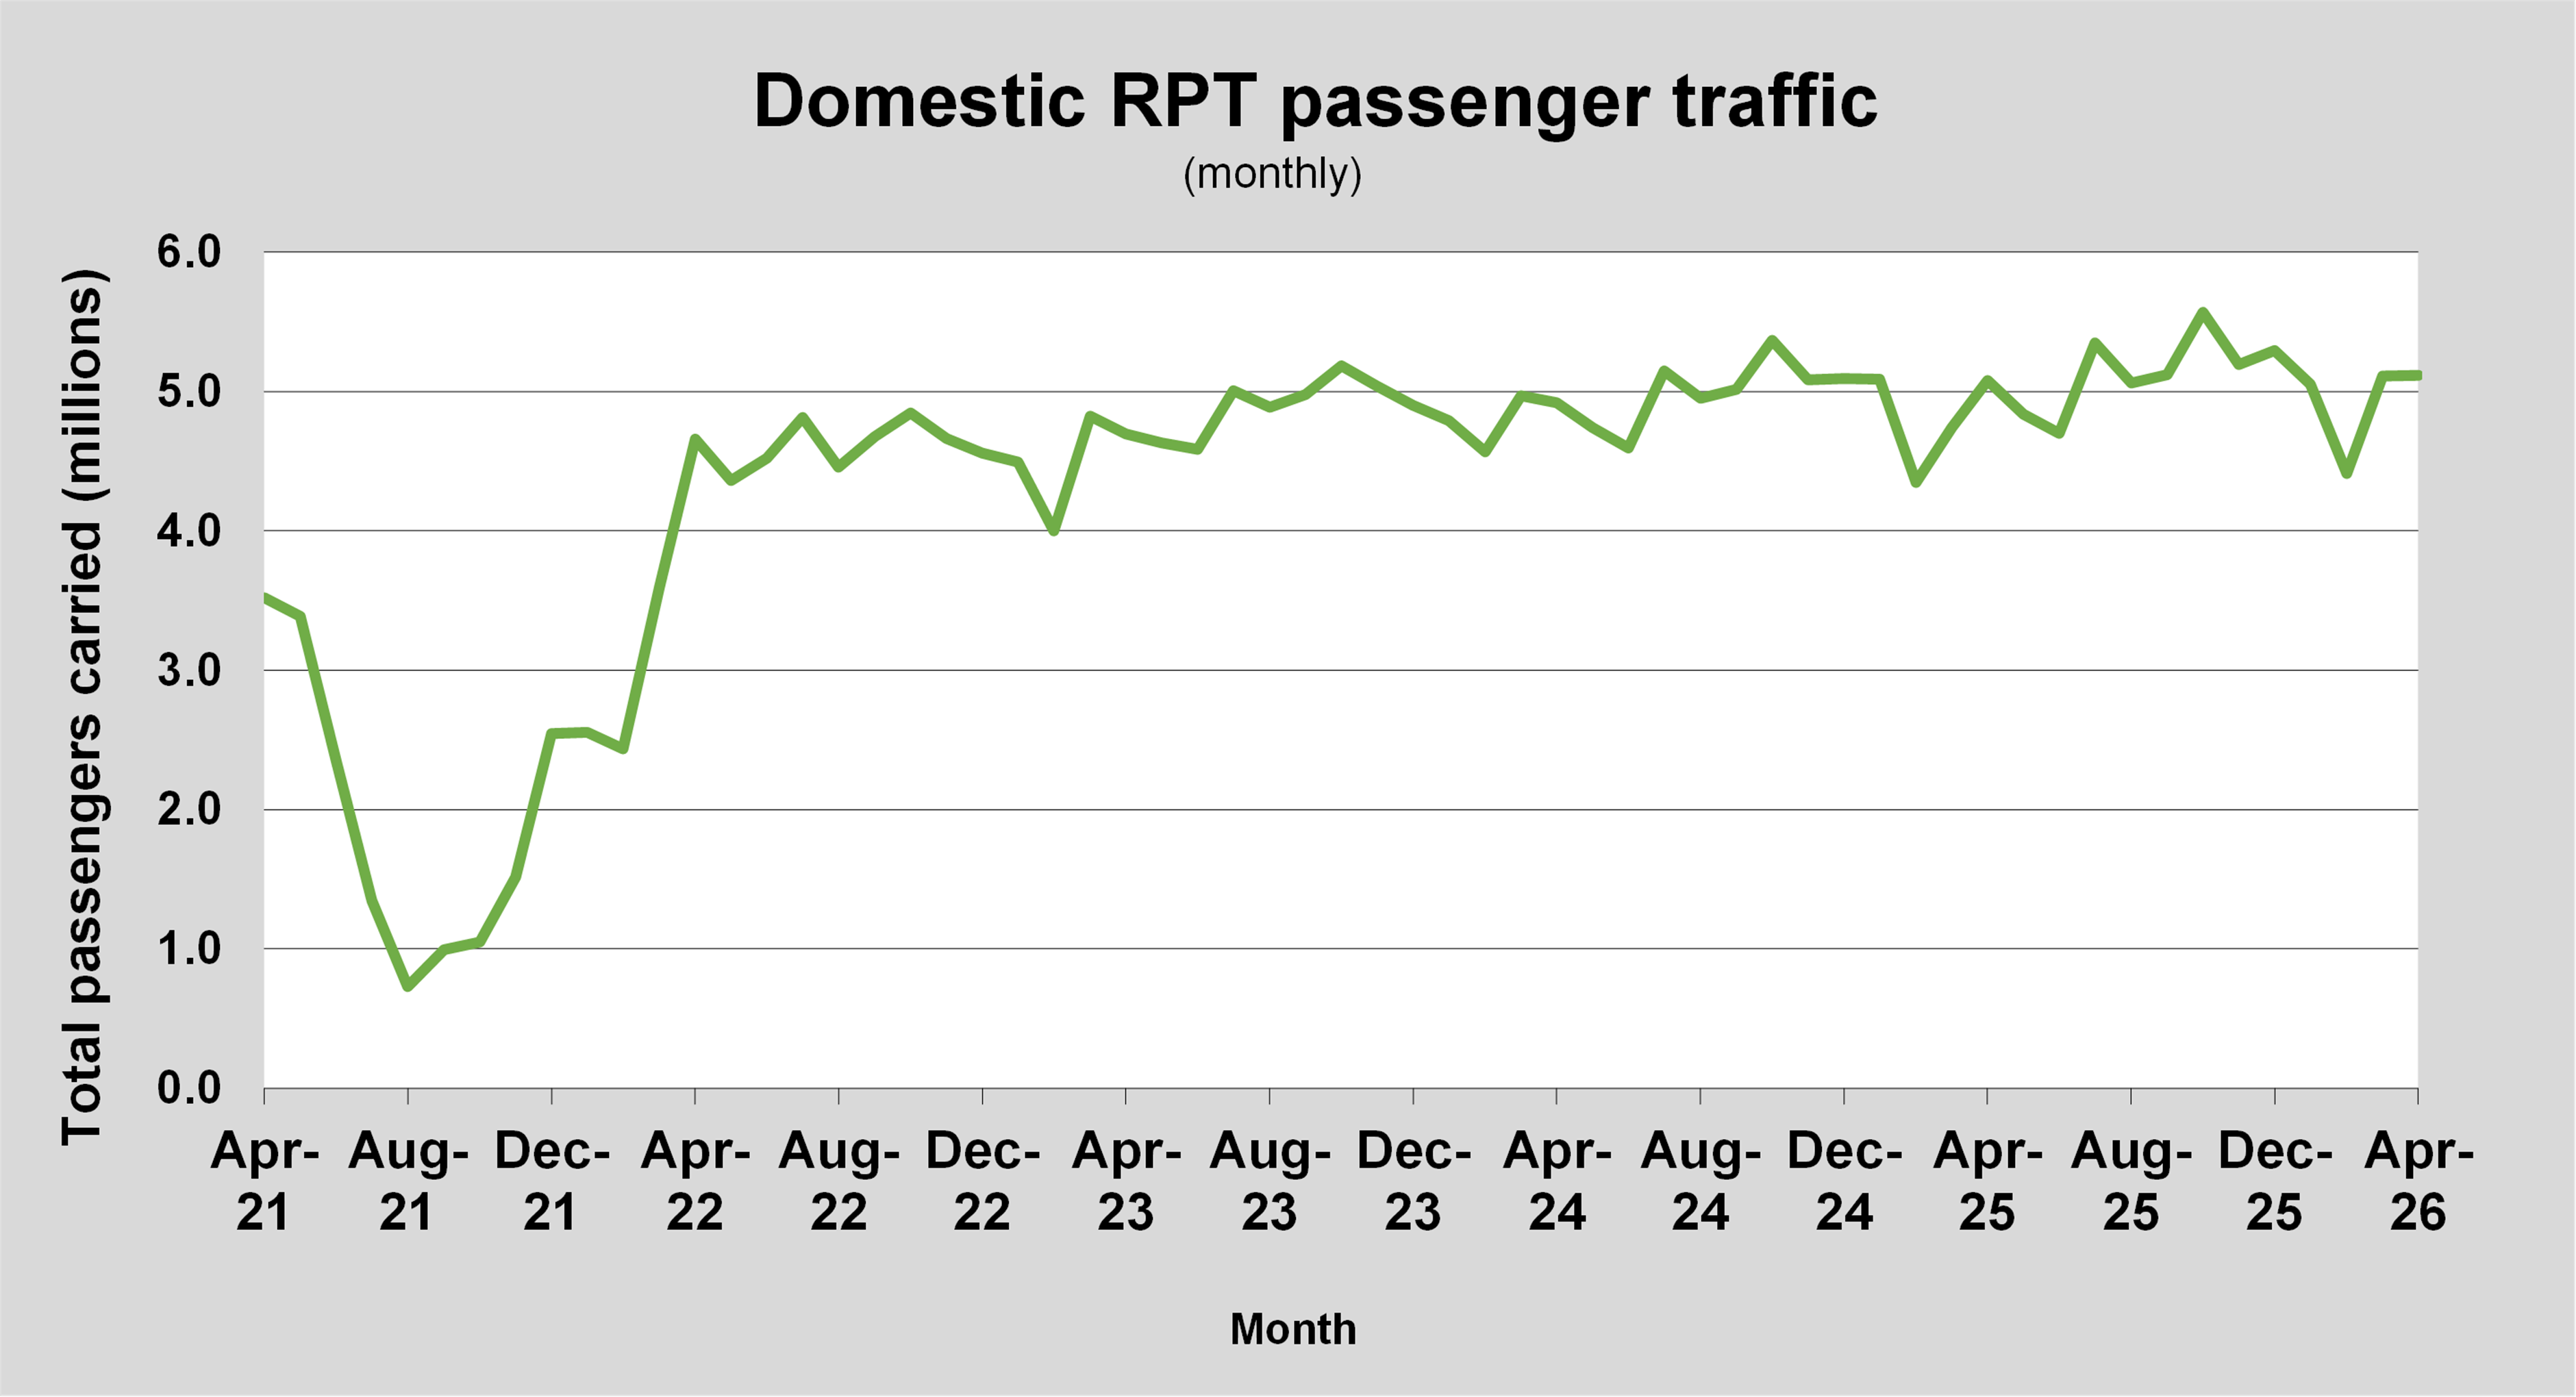
There were 5.51 million passengers carried on Australian domestic commercial aviation (including charter operations) in April 2026, compared with 5.45 million in April 2025 (up 1.1%). This is also an increase of 2.6% on pre-COVID April 2019 passenger numbers (5.37 million).
5.12 million passengers were carried on Regular Public Transport (RPT) flights in April 2026 (excluding charter operations), an increase of 0.7% compared to April 2025.
For the month of April 2026, there were 51.0 thousand RPT aircraft trips, an increase of 0.7% on April 2025.
For the year ending April 2026, there were 60.82 million RPT passengers, an increase of 2.6% on the year ending April 2025.
RPT revenue passenger kilometres (RPKs) performed were 6.19 billion for the month, compared with 6.18 billion in April 2025 (up 0.2%).
Capacity, measured by available seat kilometres (ASKs), increased to 7.64 billion in
April 2026 compared to 7.47 billion in April 2025 (up 2.4%).
The industry wide load factor (RPKs/ASKs) decreased from 82.7% in April 2025 to 81.0% in April 2026.
Total cargo movements at Australian airports on domestic RPT flights were
25.8 thousand tonnes in April 2026, an increase of 0.8% compared with April 2025.
In April 2026, there were 2.13 million domestic passenger movements through regional airports, an increase of 0.1% from April 2025.
Fixed-wing charter operators carried 394.1 thousand passengers in April 2026, an increase of 6.0% compared with April 2025.
Summary of annual RPT activity
| YE April 2025 | YE April 2026 | % Change | |
|---|---|---|---|
| Total passengers carried (millions) | 59.25 | 60.82 | 2.6 |
| Revenue passenger kilometres (billions) | 71.25 | 73.37 | 3.0 |
| Available seats (millions) | 73.38 | 75.57 | 3.0 |
| Available seat kilometres (billions) | 86.21 | 89.40 | 3.7 |
| Load factor % | 82.6 | 82.1 | -0.6* |
| Aircraft trips (000s) | 603.6 | 606.0 | 0.4 |
* percentage point difference