International airline activity—summary
Summary
Sixty-two international airlines operated scheduled services to/from Australia during the month (includes three dedicated freight airlines but excludes airlines operating only via code share arrangements).
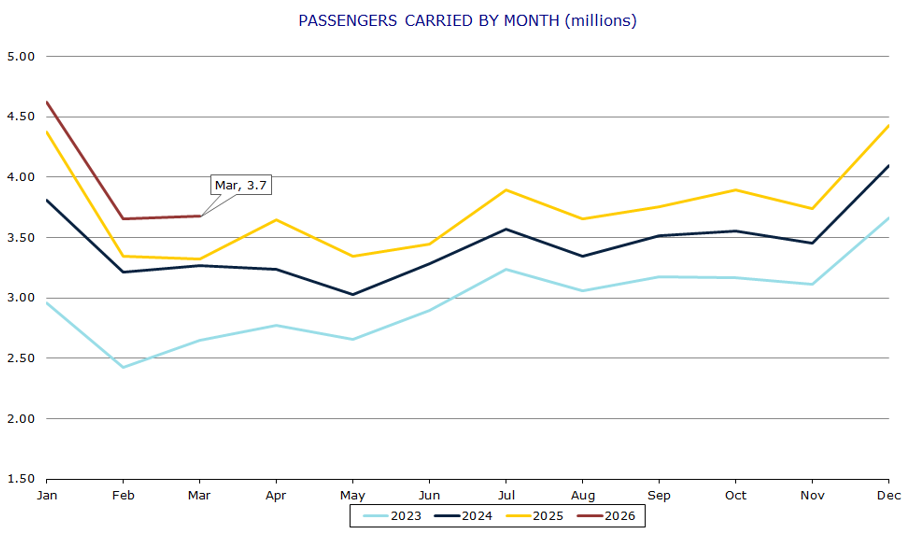
International scheduled passenger traffic in March 2026 was 3.679 million compared to 3.318 million in March 2025 – an increase of 10.9%. This is the highest ever passenger traffic recorded for the month of March.
Passenger traffic for the year ended March 2026 was 45.766 million which is an 8.7% increase over the figure for the year ended March 2025 (42.113 million).
Total seats made available on international scheduled operations to/from Australia during March 2026 were 4.541 million – an increase of 2.5% compared to March 2025. The overall seat utilisation percentage was 83.0% in March 2026. It was 76.7% in March 2025 and 78.3% in March 2024.
Summary of year-on-year activity
| Year ended March 2025 | Year ended March 2026 | % Change | |
|---|---|---|---|
| Total passenger movements (million) | 42.113 | 45.766 | 8.7 |
Summary of month-on-month activity
| March 2025 | March 2026 | % Change | |
|---|---|---|---|
| Passengers carried (million) | 3.318 | 3.679 | 10.9 |
| Freight (tonnes) | 97 743 | 92 327 | -5.5 |
| Mail (tonnes) | 2 081 | 1 952 | -6.2 |
| Available Seats (million) | 4.431 | 4.541 | 2.5 |
| Flights | 17 068 | 18 209 | 6.7 |
| Aircraft Movement | 17 468 | 18 495 | 5.9 |