Airline On Time Performance Statistics—Monthly
Summary—May 2026
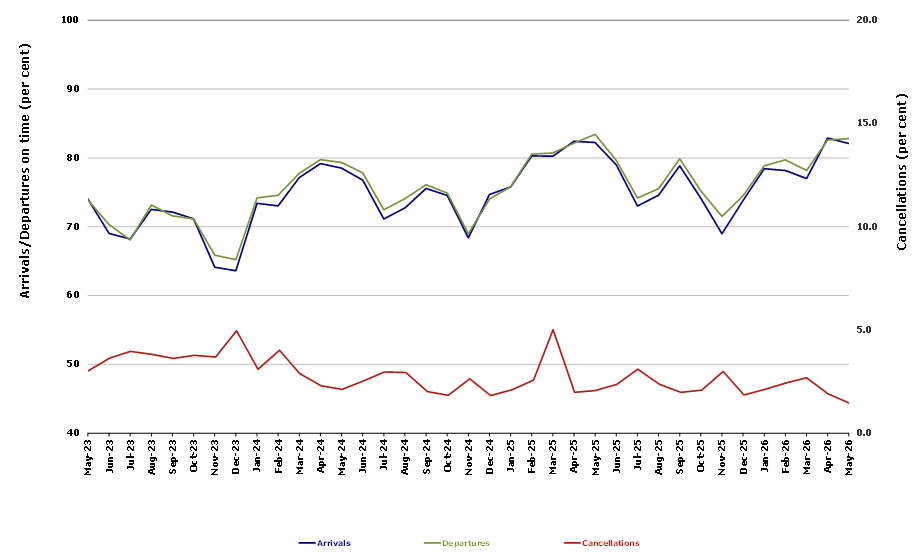
For May 2026, on time performance over all routes operated by participating airlines (Hinterland, Jetstar, Qantas, QantasLink, Rex Airlines, Skytrans Australia (formerly SmartLynx Australia), Virgin Australia and Virgin Australia Regional Airlines) averaged 82.1% for on time arrivals and 82.8% for on time departures. The cancellation rate for the month was 1.5%. The equivalent figures for May 2025 were 82.2% for on time arrivals, 83.4% for on time departures and 2.1% for cancellations.
This month’s on time arrivals figure was higher than the long-term average (average over the period of OTP reporting starting in November 2003) performance for all routes (80.5%) and the on time departures figure was also higher than the long-term average (81.6%). The rate of cancellations was lower than the long-term average of 2.2%.
On time arrivals
The Qantas network (Qantas and QantasLink combined operations) recorded 84.4% for on time arrivals while the Virgin Australia network (Virgin Australia and Virgin Australia Regional Airlines combined operations) recorded 82.7%. Hinterland achieved the highest on time arrivals at 93.3%, followed by Qantas at 84.5%, QantasLink at 84.4%, Virgin Australia at 82.8%, Skytrans Australia at 79.5%, Virgin Australia Regional Airlines at 79.0%, Jetstar at 78.8% and Rex Airlines at 71.2%.
On time departures
The Qantas network recorded 85.3% for on time departures while the Virgin Australia network recorded 84.1%. Hinterland achieved the highest level of on time departures for May 2026 at 96.7%, followed by Qantas at 87.8%, Virgin Australia at 84.1%, QantasLink at 83.9%, Virgin Australia Regional Airlines at 82.6%, Skytrans Australia at 80.1%, Jetstar at 76.2% and Rex Airlines at 73.7%.
Cancellations
QantasLink recorded the highest percentage of cancellations at 2.3% during the month. The second highest cancellation rate was from Rex Airlines at 2.2%, Skytrans Australia at 2.0%, Virgin Australia Regional Airlines at 1.4%, Qantas at 1.4%, Jetstar at 1.0%, Virgin Australia at 0.8% and Hinterland at 0.1%.
Routes
Airlines’ on time performance varies across the routes they serve. Individual route data by specific airline for 59 routes (118 sectors when counting both directions of flights) are shown on pages 10-21.
Of the 59 routes which met the criteria for on time performance reporting in May 2026, the Perth-Newman sector had the highest percentage of on time arrivals (95.2%), while the Darwin-Perth sector had the highest percentage of on time departures (96.8%). The Perth-Sydney sector had the lowest percentage of on time arrivals (63.9%), while the Gold Coast-Adelaide sector had the lowest percentage of on time departures (62.5%).
Cancellations were highest on the Port Macquarie-Sydney sector at 6.7%, followed by the Canberra-Sydney sector at 5.9%, the Sydney-Port Macquarie sector at 5.6%, the Sydney-Canberra sector at 4.9%, the Launceston-Melbourne sector at 4.8%, the Canberra-Melbourne sector at 4.5%, the Melbourne-Launceston sector at 4.4%, and the Mildura-Melbourne sector at 4.2%.
For the month of May 2026 there were 35 out of the 118 route sectors (from the 59 routes) that had zero cancellations: Adelaide-Alice Springs, Adelaide-Gold Coast, Alice Springs-Adelaide, Brisbane-Darwin, Brisbane-Hamilton Island, Brisbane-Hobart, Brisbane-Launceston, Brisbane-Mount Isa, Brisbane-Proserpine, Cairns-Sydney, Canberra-Gold Coast, Darwin-Brisbane, Darwin-Perth, Gold Coast-Adelaide, Gold Coast-Canberra, Hamilton Island-Brisbane, Hamilton Island-Sydney, Hobart-Brisbane, Hobart-Melbourne, Launceston-Brisbane, Melbourne-Darwin, Melbourne-Hobart, Melbourne-Sunshine Coast, Mount Isa-Brisbane, Perth-Broome, Perth-Darwin, Perth-Newman, Perth-Port Hedland, Proserpine-Brisbane, Sunshine Coast-Melbourne, Sydney-Cairns, Sydney-Hamilton Island, Sydney-Launceston, Ayers Rock-Melbourne, Melbourne-Ayers Rock.
Airports
Newman Airport recorded the highest percentage of on time arrivals (95.2%) and the highest percentage of on time departures (93.5%). Port Macquarie Airport recorded the lowest percentage of on time arrivals (66.7%) while Alice Springs Airport had the lowest percentage of on time departures (63.6%). These figures only refer to reported routes and do not cover all flights at these airports.
Table 1: Total Industry On Time performance for May 2026
| Reporting Airlines | Sectors Scheduled | Arrivals On Time % | Departures On Time % | Cancellations % |
|---|---|---|---|---|
| Hinterland | 1,561 | 93.3 | 96.7 | 0.1 |
| Jetstar | 7,062 | 78.7 | 76.2 | 1.0 |
| Qantas - all QF designated services | 19,355 | 84.4 | 85.3 | 1.9 |
| Rex Airlines | 4,197 | 71.2 | 73.7 | 2.2 |
| Skytrans Australia | 353 | 79.5 | 80.1 | 2.0 |
| Virgin Australia - all VA designated services | 11,424 | 82.7 | 84.1 | 0.8 |
| All Airlines | 43,952 | 82.1 | 82.8 | 1.5 |
| Individual operating entities | ||||
| Qantas | 7,000 | 84.5 | 87.8 | 1.4 |
| QantasLink | 12,355 | 84.4 | 83.9 | 2.3 |
| Virgin Australia | 11,284 | 82.8 | 84.1 | 0.8 |
| Virgin Australia Regional Airlines | 140 | 79.0 | 82.6 | 1.4 |
Figure 1: Total Industry On Time performance by month from May 2023