Airline On Time Performance, 2025 Calendar Year
Summary – 2025 Calendar Year
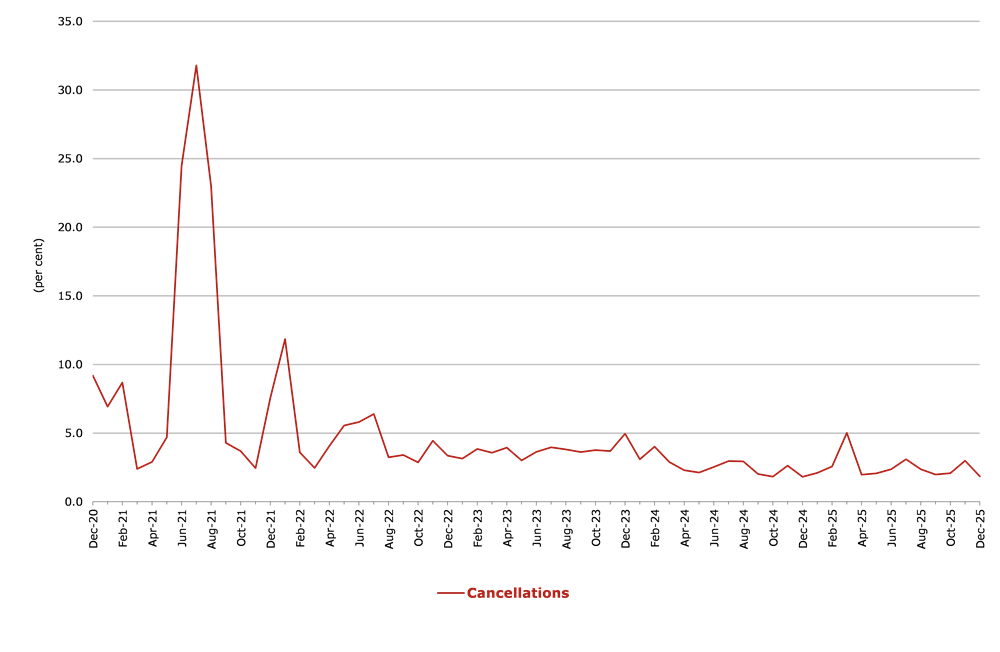
For the year ended December 2025, on time performance (OTP) over all routes operated by participating airlines (Hinterland, Jetstar, Qantas, QantasLink, Rex Airlines, Skytrans Australia (formerly Smartlynx Australia), Virgin Australia and Virgin Australia Regional Airlines) averaged 76.9 per cent for on time arrivals and 77.7 per cent for on time departures. The cancellation rate for the year was 2.5 per cent. The equivalent figures for 2024 were 74.6 per cent for on time arrivals, 75.4 per cent for on time departures and 2.6 per cent for cancellations. Airlines’ on time performance varies across the routes they serve. Individual route data by specific airline for 60 routes which operated for at least part of the 2025 calendar year are shown on pages 9-21.
The 2025 on time arrivals figure was lower than the long-term average (average over the period of OTP reporting starting in November 2003) performance for all routes (80.5 per cent) and the on time departures figure was also lower than the long-term average (81.6 per cent). The rate of cancellations was higher than the long-term average of 2.2 per cent.
On time arrivals
The Qantas network (Qantas and QantasLink combined operations) recorded 77.9 per cent for on time arrivals while the Virgin Australia network (Virgin Australia and Virgin Australia Regional Airlines combined operations) recorded 76.0 per cent. Hinterland achieved the highest on time arrivals at 88.4 per cent, followed by Skytrans Australia at 85.1 per cent, QantasLink at 78.3 per cent, Qantas at 77.2 per cent, Virgin Australia at 76.0 per cent, Jetstar at 75.2 per cent, Rex Airlines at 73.0 per cent and Virgin Australia Regional Airlines at 71.5 per cent.
On time departures
The Qantas network recorded 78.8 per cent for on time departures while the Virgin Australia network recorded 77.0 per cent. Hinterland achieved the highest level of on time departures for 2025 at 92.5 per cent, followed by Skytrans Australia at 86.3 per cent, Qantas at 79.7 per cent, QantasLink at 78.3 per cent, Virgin Australia at 77.2 per cent, Rex Airlines at 76.0 per cent, Jetstar at 73.6 per cent and Virgin Australia Regional Airlines at 67.6 per cent.
Cancellations
Skytrans Australia recorded the highest percentage of cancellations at 8.4 per cent during the year. The second highest cancellation rate was from QantasLink at 3.6 per cent, followed by Qantas at 2.7 per cent, Rex Airlines at 2.5 per cent, Jetstar at 2.2 per cent, Virgin Australia at 1.7 per cent, Virgin Australia Regional Airlines at 1.1 per cent and Hinterland at 0.8 per cent.
Routes
Of the 60 routes which met the criteria for OTP reporting, the Townsville-Cairns route (Jan 2025 only) had the highest percentage of on time arrivals (90.9 per cent) and the highest percentage of on time departures (90.9 per cent). For those routes reporting for the entirety of 2025, Emerald-Brisbane had the highest percentage of on time arrivals (89.8 per cent) and the highest percentage of on time departures (88.4 per cent). The Hamilton Island-Sydney route had the lowest percentage of on time arrivals (60.8 per cent) and the lowest percentage of on time departures (61.6 per cent).
Cancellations were highest on the Canberra-Sydney route at 6.2 per cent, followed by the Sydney-Canberra route at 5.6 per cent, the Port Lincoln-Adelaide and Sydney-Melbourne routes at 4.4 per cent, the Port Macquarie-Sydney and Melbourne-Sydney routes at 4.3 per cent, the Adelaide-Port Lincoln and Gladstone-Brisbane routes at 4.1 per cent, the Sydney-Port Macquarie route at 4.0 per cent and the Devonport-Melbourne route at 3.9 per cent.
Cancellations were lowest on the Melbourne-Ayers Rock at 0.0 per cent, followed by the Sydney-Hamilton Island route at 0.1 per cent, Ayers Rock-Melbourne and Sydney-Cairns routes at 0.3 per cent, and the Perth-Newman and Melbourne-Sunshine Coast routes at 0.4 per cent.
Airports
Of the airports with OTP reporting for 2025, Emerald Airport recorded the highest percentage of on time arrivals (86.2 per cent) and the highest percentage of on time departures (88.4 per cent). Port Macquarie Airport recorded the lowest percentage of on time arrivals (70.0 per cent) and Broome Airport recorded the lowest percentage of on time departures (64.8 per cent). These figures only refer to reported routes and do not cover all flights at these airports.
| Reporting Airlines | Sectors Scheduled | Arrivals On Time % | Departures On Time % | Cancellations % |
|---|---|---|---|---|
| Hinterland | 18,415 | 88.4 | 92.5 | 0.8 |
| Jetstar | 96,686 | 75.2 | 73.6 | 2.2 |
| Qantas - all QF designated services | 231,962 | 77.9 | 78.8 | 3.2 |
| Rex Airlines | 52,716 | 73.0 | 76.0 | 2.5 |
| Skytrans Australia (formerly SmartLynx Australia) | 6,191 | 85.1 | 86.3 | 8.4 |
| Virgin Australia - all VA designated services | 145,379 | 76.0 | 77.0 | 1.7 |
| All Airlines | 551,349 | 76.9 | 77.7 | 2.5 |
| Individual operating entities | ||||
| Qantas | 88,886 | 77.2 | 79.7 | 2.7 |
| QantasLink | 143,076 | 78.3 | 78.3 | 3.6 |
| Virgin Australia | 143,031 | 76.0 | 77.2 | 1.7 |
| Virgin Australia Regional Airlines | 2,348 | 71.5 | 67.6 | 1.1 |
Figure 1. Total Industry Arrivals and Departures On Time by month from December 2020
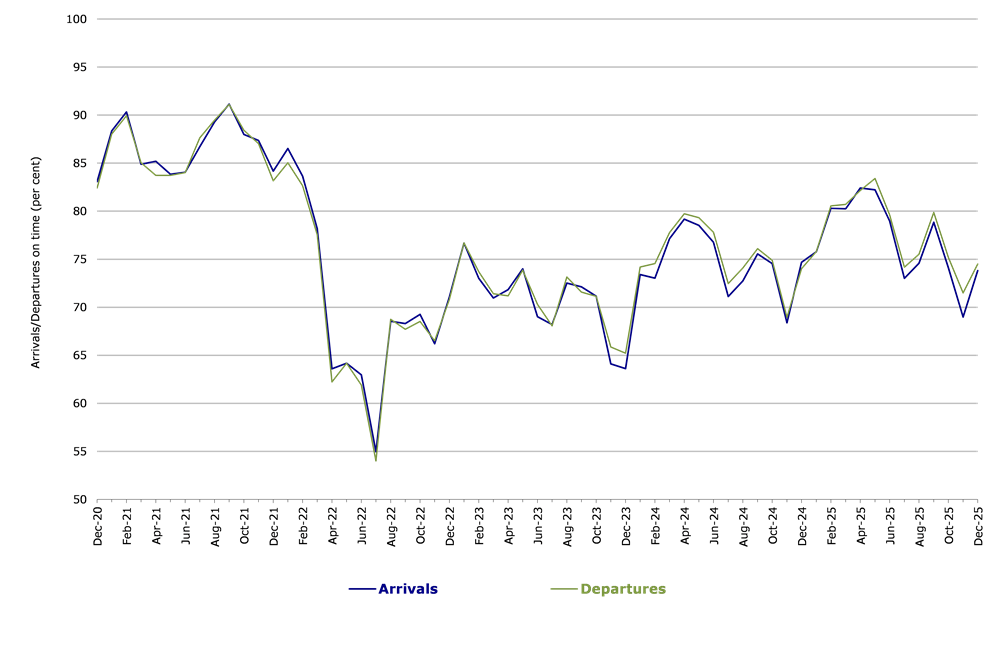
Figure 2. Total Industry Cancellations by month from December 2020