Statistics
Shipping
Chapter 9: shipping
Download data
- Shipping—Yearbook 2024 (136 KB) - Download Excel file
- Australian Infrastructure and Transport Statistics—Yearbook 2024 - Download PDF
This chapter provides information on Australian ships, cargo, ports and fleet including mileage, tonnage and number of vessels. The data is sourced from BITRE's Australian Sea Freight publication, BITRE's Waterline publication and BITRE estimates based on Lloyds List Intelligence Data.
- There were 53 Australian registered vessels in the Australian trading fleet, including small vessels, and 83 overseas registered vessels in 2022–23.
- Queensland had the largest discharged volume with 40 million tonnes in 2020–21. Following Queensland was New South Wales and Victoria with 33 million tonnes discharged each.
- Western Australian ports loaded 1 billion tonnes of maritime cargo in 2020–21, the largest volume in Australia. Next, Queensland and New South Wales loaded 289 million tonnes and 176 million tonnes respectively. Together the ports in these 3 states loaded 94% of Australia's maritime cargo by volume in 2020–21.
- 8.6 million TEUs (twenty-foot equivalent units) were exchanged at container terminals in Brisbane, Sydney, Melbourne, Fremantle and Adelaide in 2022–23.
Figure 19 Principal Australian ports, by commodity
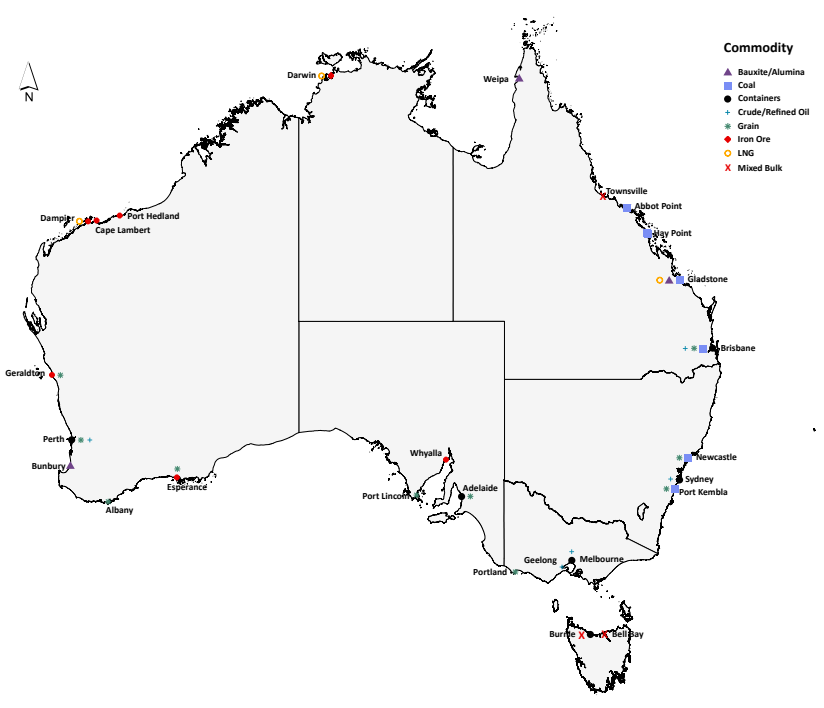
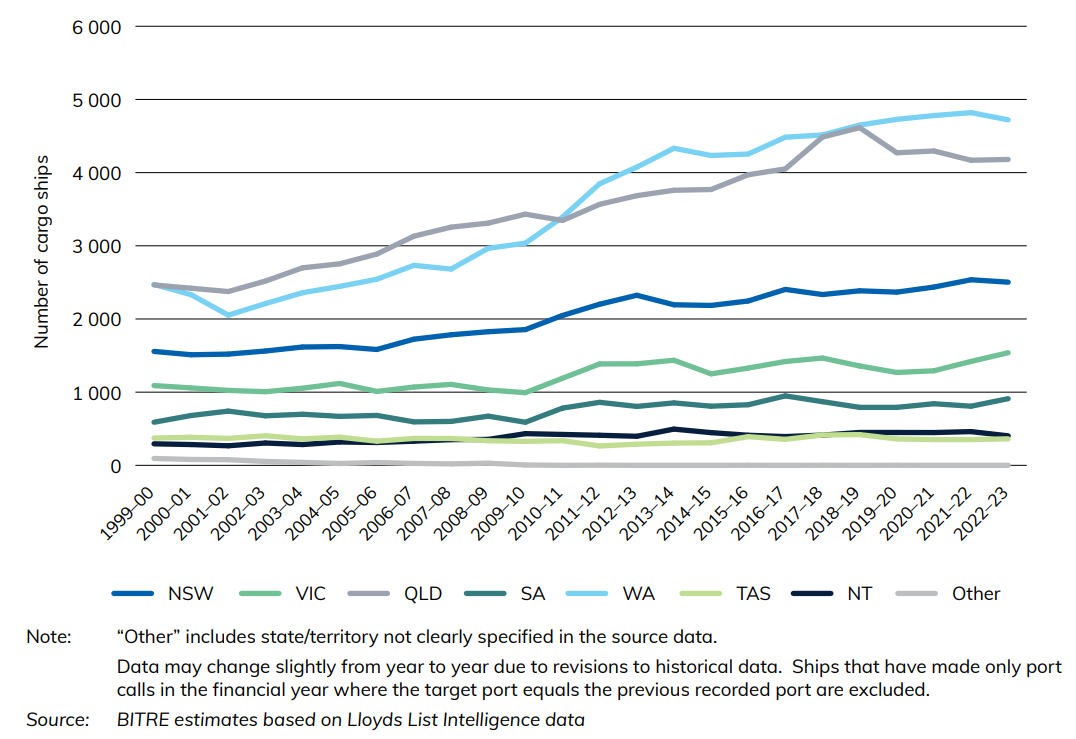
Figure 20 provides a state breakdown of the number of cargo ships on coastal or international voyages that made port calls from 1999-00 to 2022-23. The majority of states saw increases during this time period. Queensland and Western Australia experienced the largest numerical increases and were consistently Australia's 2 most-visited states by cargo ships.
Figure 20 Number of cargo ships involved in coastal or international voyages that made port calls, by state/territory