
Domestic aviation activity
Further down this page are graphs and summary analysis relating to domestic aviation activity. Additional information can also be found at the following links:
Summary
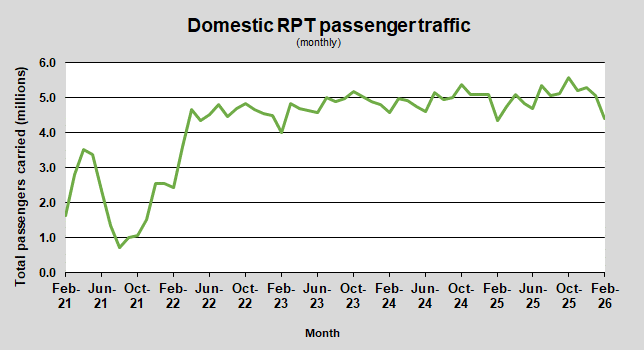
There were 4.77 million passengers carried on Australian domestic commercial aviation (including charter operations) in February 2026, compared with 4.67 million in February 2025 (up 2.1%).
This is also an increase of 3.8% on pre-COVID February 2020 passenger numbers (4.60 million).
4.41 million passengers were carried on Regular Public Transport (RPT) flights in February 2026 (excluding charter operations), an increase of 1.4% compared to February 2025.
For the month of February 2026, there were 45.8 thousand RPT aircraft trips, an increase of 1.4% on February 2025.
RPT revenue passenger kilometres (RPKs) performed were 5.14 billion for the month, compared with 5.07 billion in February 2025 (up 1.3%).
Capacity, measured by available seat kilometres (ASKs), increased to 5.62 billion in February 2026 compared to 5.45 billion in February 2025 (up 3.2%).
The industry wide load factor (RPKs/ASKs) decreased from 80.5% in February 2025 to 79.3% in February 2026.
Total cargo movements at Australian airports on domestic RPT flights were 24.8 thousand tonnes in February 2026, an increase of 0.5% compared with February 2025.
In February 2026, there were 1.83 million domestic passenger movements through regional airports, an increase of 2.7% from February 2025.
Fixed-wing charter operators carried 359.8 thousand passengers in February 2026, an increase of 11.5% compared with February 2025.
Summary of annual RPT activity
| YE February 2025 | YE February 2026 | % Change | |
|---|---|---|---|
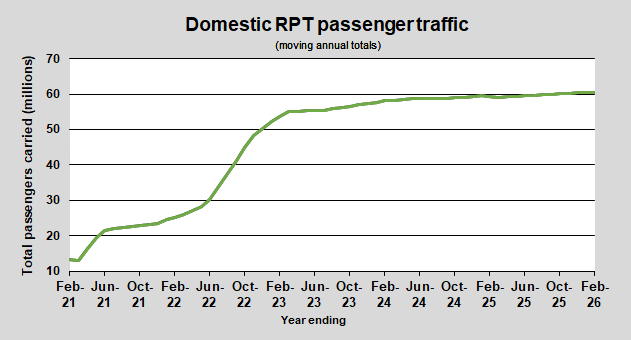
| Total passengers carried (millions) | 59.37 | 60.46 | 1.8 |
| Revenue passenger kilometres (billions) | 71.23 | 72.97 | 2.4 |
| Available seats (millions) | 74.00 | 75.12 | 1.5 |
| Available seat kilometres (billions) | 86.71 | 88.82 | 2.4 |
| Load factor % | 82.1 | 82.2 | 0.0* |
| Aircraft trips (000s) | 609.1 | 603.9 | -0.8 |
* percentage point difference