Statistics
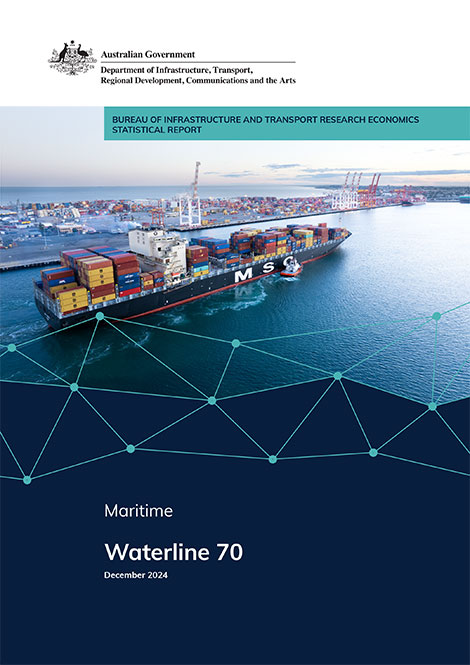
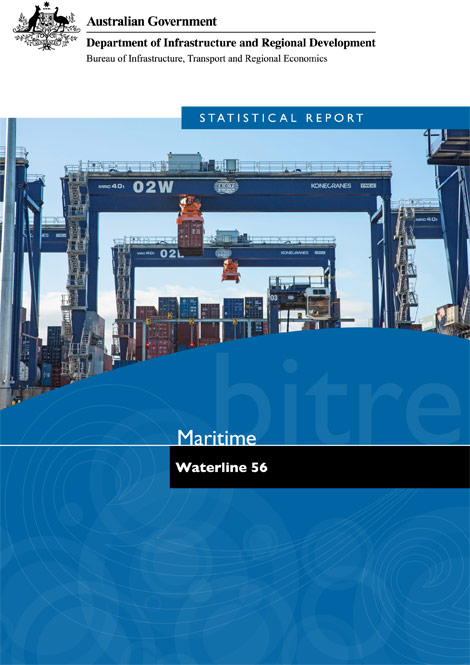
Waterline 56—May 2015
Waterline provides the latest data on throughput, container handling productivity (both wharf-side and landside), and the cost of importing and exporting containers. It covers the unloading of container ships and the transport of containers from terminals. Highlights from this edition include:
- Throughput at Australian ports increased 3% over the period July-December 2014 relative to the previous year, with a total throughput of 3.7 million TEUs. This compares to non-farm GDP growth over the same period of 2.7%: port throughput continues to increase faster than non-farm GDP. Fremantle experienced the strongest increase of 11.3%; the other ports showed more modest growth, except Adelaide, which recorded a 2.6% decline.
- Wharf-side productivity showed a modest improvement in average labour productivity (up 0.9%); however reduced crane rates (down 3.3%) showed lower capital productivity and translated to longer median ship turnaround rates at Brisbane, Sydney and Melbourne. Fremantle exhibited the strongest performance (with elapsed labour rate, crane rate and ship rate improvements of 39.4, 32.8 and 10.9% respectively), with the sharpest declines in Brisbane (elapsed labour rate and ship rate down by 12.3 and 14.5% respectively).
- Land-side efficiency continued its decline in all ports except Adelaide: average truck and container turnaround times increased by 5.7 and 4.7%, respectively.
- The Port Interface Cost Index (PICI) increased by $10-$14/TEU over the reporting period, with the larger increases for smaller vessel sizes. Port Interface Cost for medium- and large-size vessels is now approaching parity. While historically, port handling costs have been declining as the general price level across the economy (the GDP deflator) has been increasing, this trend has reversed since 2010, and port interface costs are now rising.